Car Insurance Claim Data File
We want to see if we can predict the number of car insurance claims that will be filed using three potential predictors: the age of the policyholder, the age of the car, and the cost of claims. Following the approach, I've given you in a Word document and in a video, run the multiple regression analysis. Use the Enter method, and use alpha = .01. Then answer these questions:
1. Does the regression equation as a whole predict number of claims significantly better than chance?
The p-value of the F-stat in the ANOVA table is close to zero. Since this p-value is lower than the alpha value of 0.01, we reject the null hypothesis and conclude that the regression equation as a whole predict number of claims significantly better than chance
2. What part of the output and what number(s) did you look at that allowed you to answer Question 1?
The part of the output that is used to answer Question 1 is as follows:
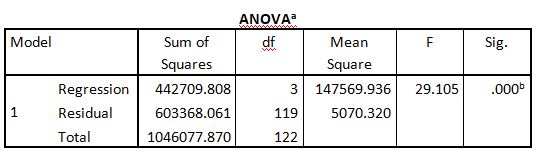
a. Dependent Variable: Number of claims
b. Predictors: (Constant), Average cost of claims, Policyholder age, Vehicle age
The p-value of the F-stat (close to zero) is compared with the alpha value (0.01) to make the decision.
3. What is the effect size for the analysis? Give the name and number.
Cohen’s F2 = r2 / (1-r2 ) = 0.423/(1-0.423) = 0.733
4. List which of the three predictors was/were significant and which was/were not?
The p-value of policyholder age and vehicle age is close to zero, hence these two variables are significant. However, the p-value of the average cost of claims is greater than 0.01 at 0.023 and thus, this variable is not significant.
5. Using the standardized (z-score) solution, write the formula for Y?
Y = 0.326*Policyholderage – 0.636*Vehicleage – 0.196*AvgCostofClaims
6. In other words, what can you conclude about your ability to predict Y from the three X-variables? Do note that if a predictor has a negative coefficient, that's like a negative correlation and it means that as the predictor goes up, the correlation goes down. Put this answer in words, not in numbers?
The standardized coefficient of policyholder age is 0.326 suggests that on average, keeping vehicle age and avg cost of claims constant, an increase in one standard deviation of policyholder’s age by 1-year results in 0.326 more number car insurance claims.
Similarly, the standardized coefficient of vehicle age is -0.636 suggests that on average, keeping policyholder’s age and avg cost of claims constant, an increase in one standard deviation of vehicle age by 1-year results in a 0.636 lower number of car insurance claims.
And, the standardized coefficient of average cost of claims is -0.196 suggests that on average, keeping vehicle age and policyholder’s age constant, an increase in one standard deviation of average cost of claims by 1 unit results in 0.196 less number of car insurance claims.