Problem Description:
This Statistical Analysis homework aimed to gain insights into the hiring policies and practices of employers when considering entry-level workers in the Milwaukee metropolitan area. The study sought to uncover the employer's disposition towards applicants with criminal records and whether such records affected these applicants more unfavorably than other marginalized groups. Furthermore, the research aimed to understand the role played by the type of crime or context of sanctions in an employer's evaluation. Additionally, the study sought to investigate the formal criteria used by employers to evaluate entry-level applicants. Lastly, it examined how various job characteristics, company attributes, and labor market conditions influenced an employer's willingness to consider applicants with prior criminal records.
Solution
Variables of Interest
A2B – MINORITY-OWNED COMPANY: whether the company is owned by a minority group (Binary: Yes/no)
G5 – BUSINESS HIRED CRIMINAL BACKGROUND: whether the company has hired an employee with criminal background (Binary: Yes/No)
C6C – APPLICANTS INTERVIEWED: the proportion of applicant interviewed by the respondent (Numeric %)
C43C – RESPONDENT AGE: Age of respondents (Numeric: years)
C2A – EMPLOYEE RACIAL BACKGROUND: race of the employee (Categorical: 4 levels)
CA7 – APPLICANTS – BLACK: whether the applicant is Black (Numeric)
C7B – APPLICANTS – HISPANIC: whether the applicant is Hispanic (Numeric)
CB19 – APPLICANTS – WHITE: whether the applicant is White (Numeric)
C21_A – STARTING WAGE DOLLARS: Starting Salary (Numeric)
DESRIPTIVE STATISTICS
Table 1: Summary statistics
| Variable | Obs | Mean | Std. Dev. | Min | Max |
|---|---|---|---|---|---|
| applicants interviewed | 164 | 8.195122 | 12.64808 | 0 | 100 |
| respondents’ age | 166 | 39.36747 | 11.59325 | 18 | 75 |
| APPLICANTS – BLACK | 150 | 26.43333 | 23.61731 | 0 | 100 |
| APPLICANTS – HISPANIC | 149 | 13.98658 | 13.9211 | 0 | 79 |
| APPLICANTS – WHITE | 153 | 56.2549 | 28.13631 | 0 | 100 |
| STARTING WAGE DOLLARS | 142 | 1954.965 | 8249.228 | 2 | 55000 |
| MINORITY-OWNED COMPANY | Freq. | Percent |
|---|---|---|
| Yes | 14 | 8.38 |
| No | 153 | 91.62 |
| Total | 167 | 100 |
| BUSINESS HIRED CRIMINAL BACKGROUND | ||
|---|---|---|
| Yes | 75 | 47.47 |
| No | 83 | 52.53 |
| Total | 158 | 100 |
| EMPLOYEE RACIAL BACKGROUND | ||
|---|---|---|
| White | 94 | 60.26 |
| Black | 36 | 23.08 |
| Hispanic | 16 | 10.26 |
| Others | 10 | 6.41 |
| Total | 156 | 100 |
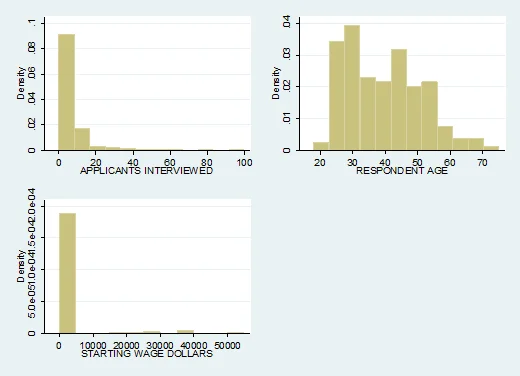
Fig 1: Histogram
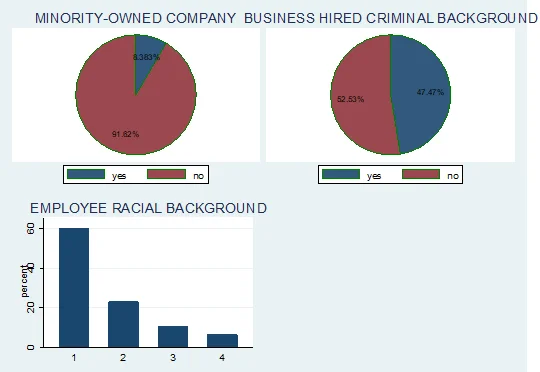
Fig 2: Pie and Bar Chart
Report
Table 1 presents the summary statistics of the continuous variables in the model. The result showed that average value of applicants interviewed is 8.19 while the variation around the mean measured by standard deviation is 12.65. The number of valid observation is 164. The lowest value of applicants interview is 0 and the highest is 100. Average value of respondents’ age viewed is 39.37 while the variation around the mean measured by standard deviation is 11.59. The number of valid observation is 166. The lowest value of respondents’ age is 18 and the highest is 75. In addition, average value of black applicant is 26.43 while the variation around the mean measured by standard deviation is 23.61. The number of valid observation is 150. The lowest value of black applicant is 0 and the highest is 100. Average value of hispanic applicant is 26.43 while the variation around the mean measured by standard deviation is 23.61. The number of valid observation is 149. The lowest value of Hispanic applicant is 0 and the highest is 100. Average value of White applicant is 56.25 while the variation around the mean measured by standard deviation is 28.14. The number of valid observation is 149. The lowest value of Hispanic applicant is 0 and the highest is 100.
Table 2 presents the frequency distribution of the categorical variables. The result showed that 60.26% of the respondents are white, 23.08% are black, 10.26% are Hispanic while 6.41% belong to other race. 8.38% of the organization sampled are minority owned while 91.62% are not. Finally, 47.7% of the firms sampled hired workers with criminal background while 52.53%. The same information is presented graphically in fig 2. Fig 1 presents histogram for applicant’s interviewed, respondents age and starting wage in dollar. The plot showed that none of the variables is symmetric.