Figure 4: Histogram of AgeGenerating measures of central tendency and interpreting the results
The solution is based on both measures of central tendency and measures of dispersion using SPSS. The solution helps to group people based on their level of income and family size.
Task
Generate tables and graphs from the provided data set and paste them into a Word file.
Write up a small description of what you see in the output (required). use the following symbols: N= sample, M= for mean, median= median, range = range, SD= standard deviation, and %=percentage
Descriptive Statistics
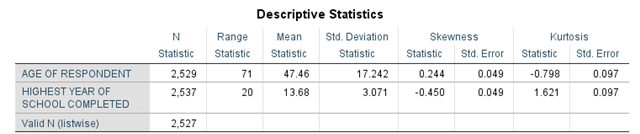
Figure 1: Table of descriptive statistics for continuous variables: Age, Education
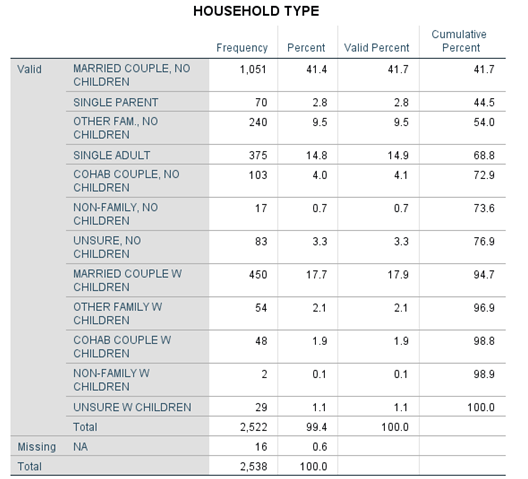
Figure 2: Frequency table for the household type
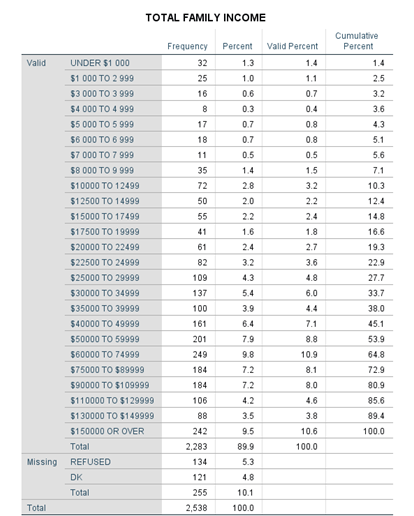
Figure 3: Frequency table for the total family income
Graphs
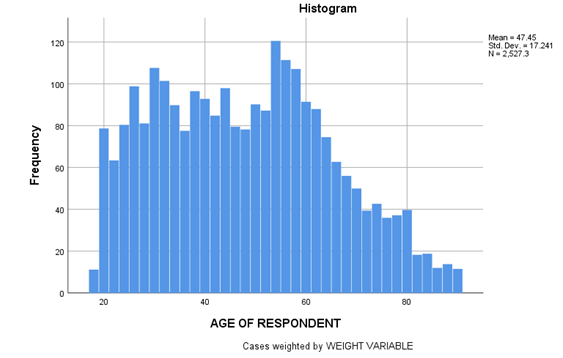
Figure 4: Histogram of Age
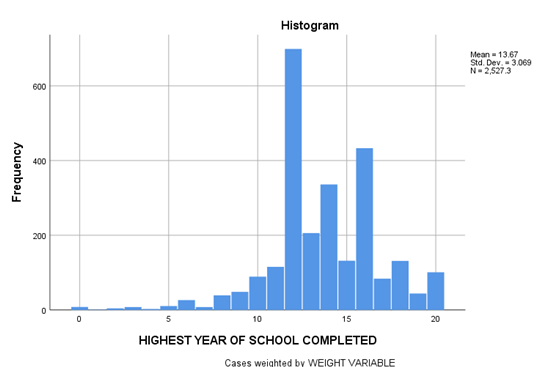
Figure 5: Histogram of the year of education
Writeup
The data was comprised of N=2538 observation with a mean age of 47.46 years (SD = 17.24). The distribution of the age variable resembled that of the right-skewed distribution. The average years of education were 13.68 years (SD = 3.07) and the distribution resembled that of a left-skewed shape
| Variable | 1SD | 2SD | 3SD |
| Age | 17.24 | 34.48 | 51.73 |
| Education | 3.07 | 6.14 | 9.21 |
The 1SD, 2SD, and 3SD values are given in the table above.
For the categorical variables like Household type and Total family income, a frequency table was prepared and analyzed. The most frequent type of household was a married couple with no children (41.4%), and married couple with children (17.7%), with Single adult being 3rdmost frequent (14.8%) and other categories accounted for 26.1%. The total family income, though categorized, seemed to be resembled left-skewed distribution with between $60K to $75K being the most frequently observed category (9.8%) and the peak appears to be around this category.