Multiple choice questions and short answers
Part I: True/False/Don’t Know
• True, False, or I Don’t Know?
T / F / DK Instrumental variable analyses are very difficult to do in the real world because, outside of an RCT, it’s difficult to find “instruments” that meet the relevance, exclusion, and exchangeability criteria.
TRUE
T / F / DK You could use some form of linear regression to accurately model the data below.
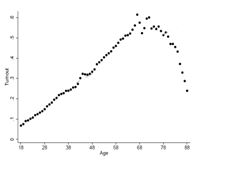
TRUE
T /F / DK It is unreasonable to expect one study or analysis to answer everything about some big issue like “Is inequality bad for the economy?” When conducting studies – or reading and critiquing them – it is important to keep both the bigger issue being addressed and the specific question you want – or the other researchers wanted – to answer in mind.
False
T / F / DK Regression is a great tool for confounding control because you can place any potential confounder – known or unknown, measured or unmeasured – into your model to adjust for it.
False
T / F / DK It’s best as a quantitative analyst to just objectively work with the data; don’t let subject matter experts color your analysis with their subjective domain knowledge.
TRUE
T / F / DK Typically (when calculating a proportion, at least), you want to ensure your denominator includes everything that could have given rise to anything in the numerator, but nothing extra that couldn’t.
FALSE
T / F / DK P(study | pass this final) = P(pass this final | study)
FALSE
T / F / DK “p-hacking” can but doesn’t have to be malicious – it can be done subconsciously or accidentally by otherwise well-meaning researchers.
TRUE
T / F / DK Every sample statistic (means, medians, proportions, etc.) has a standard error, which can be thought of as the “bounciness” of the estimate from sample to sample.
TRUE
T / F / DK If you know you’ll have to dichotomize something to make a decision, do so as early in the analytical process as you can (like when you collect the data) so that you propagate that dichotomization throughout the entire analysis and everything stays consistent.
TRUE
Part II: Scenarios
Below are 5 scenarios with some sort of quantitative thinking concern, inference problem, or bias we’ve encountered through the semester so far. Identify it and explain why it’s an issue in 1-2 sentences.
• This paragraph from p. 44 of Tiamat’s Wrath, the eighth book in the Expanse series by James S.A. Corey:
“[Teresa Duarte, the daughter of the emperor of Laconia, had] lived her whole life in – or occasionally and clandestinely just outside – the State Building on Laconia. Since she’d been a toddler, other children had been brought in to be her friends and classmates. Usually from the most favored families of the empire, but sometimes because her father wanted her to know a variety of kinds of people. He wanted her to have as close as she could get to a normal life. To be as close as she could be to a normal fourteen-year-old. And it worked as well as it worked, but since she only had her own life to judge from, she couldn’t really say how successful it had been.”
This is an inference problem because the observed metrics that can be used to measure normality to life for Teresa Duarte, the daughter of the emperor of Laconia do not have any means of comparison. Therefore, inferences cannot be made.
• Per economist Milton Friedman, a (publicly held) corporation’s primary ethical responsibility is to its shareholders. As a result Hank Scorpio, the CEO of Globex Corporation, receives compensation heavily tied to the company’s stock price at the end of each quarter. Hank develops a near-singular focus on keeping that high during his tenure and does whatever is necessary to make it happen. When Globex runs a surplus in a quarter despite concerns about long-term viability, they put all of it into dividends (cash payouts, basically) for shareholders to boost their stock price rather than investing in desperately-needed new technology, raising salaries to attract better talent, or setting up a rainy day fund.
This scenario will bring about bias as shareholders have failed to consider possible viability and they put all of it into dividends (cash payouts, basically) for shareholders to boost their stock price rather than investing in desperately-needed new technology, raising salaries to attract better talent, or setting up a rainy-day fund.
• You’re the health minister of a developing country. A team of data scientists from the company Clearbrain (yes, a real company!), comes to you and promises they can take information from a dietary survey of your citizens and, using their proprietary artificial intelligence (AI) algorithm, automatically determine which nutrients cause improved longevity in your country without any need to hire additional expensive scientists to help. Then you can begin a program to encourage the consumption of foods rich with them. The algorithm isn’t free, of course, and Clearbrain normally works with marketing data for businesses, not public health.
NOTE: There are several different potential answers here.
Error, bias, and validity are possible problems that because Clearbrain is going out of their area of focus, their algorithm has also not been tested within public health
• You’re a business analyst for Hilton Hotels. You want to know what aspects of a rewards program are associated with greater client retention/repeat bookings. You start by looking at the correlation with retention of 10 different possible reward redemption types in 5 different client age brackets. You report to your boss on the two reward-age combinations that were statistically significant, advocating for a campaign to highlight these rewards in marketing materials to those groups to drive greater retention.
NOTE: Be specific. “The associations may not be causal” or “causation vs. correlation” is not sufficient here.
Based on the tests, it will be difficult to establish that the selected reward-age combination actually maintains a causal influence on client retention as there might be a need to include some other confounding factors.
• Oxford decides* take the faculty members with the three worst average course evaluation scores each semester and send them for some “remedial” (they don’t call it that, but we know what it is) teaching training. They assess the efficacy of this training by noting that these faculty members’ average scores increased by 0.5 points the next semester and elect to enter a 5-year contract with the training provider.
*Note this is completely made up. They don’t do this. Any resemblance to any program living or dead is purely coincidental.
There appears to be an inference problem in this situation, No hypothesis was tested so the conclusion was based on observation of descriptive measures.
• This tweet. What’s his kid’s problem?

His Kid’s problem is that he failed to make reference to the principle of cause and effect.
Part III: Short Answer
• What is one reason – beyond that they may focus on their sport at the expense of their studies, or that they don’t care about classes – that all the athletes admitted to the University of Georgia* (go Gators) are so dumb**?
*Note for international students: in the U.S. many public (and some private) colleges explicitly recruit and admit some students for athletic rather than just academic prowess, particularly in football and basketball.
**Not actually all athletes. There are many scholar-athletes, even at UGA, who are also excellent students. This is also not really a problem at places like Emory and Oxford where we have less…flexible academic standards for admission.
• Explain in 2-3 sentences what your scatterplot shows and how the true correlation between the two variables in the entire population is altered.
From the scattered plot displayed above, it can be observed that despite the strong linear relationship between the 2 qualities, there appear to be some points falling out of the linear horizon which is an indication that the true correlation between the two variables in the entire population is altered
• In the early 2000s, researchers conducted a large survey of 450 undergraduates in various introductory courses at the University of Mississippi and Mississippi State University. Among many other things, they asked students if they had ever overdrawn a checking account (meaning they took more money out than was available in their account, leaving them with a negative balance and owing to the bank money).
Perhaps as a researcher you are interested in whether other irresponsible behavior, like regular alcohol consumption (as measured by the number of days you drank in the past 30 days), is associated with irresponsible financial behavior (as measured by overdrawing your checking account: 0 = Never, 1 = Ever).
• Here is the output from a crude model investigating that association.
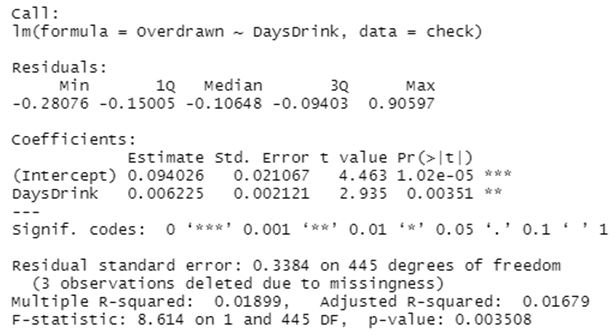
Write the linear regression model being run above, using symbols rather than numbers.
Overdrawn=α+βDaysDrink+ε
Note this model is different from the ones you’ve seen before as it’s actually modeling a binary (0/1) outcome rather than a continuous outcome. When you use linear regression to do this it’s called a linear probability model (LPM), and it’s the subject of much debate vs. other more sophisticated techniques like logistic regression that you don’t know yet. Suffice it to say, I think the LPM is fine to use here for reasons we don’t need to get into.
My first challenge to you: if the model outputs a prediction of approximately “0.2” for a student who drank 18 days in the last 30, how would you interpret that prediction? HINT: Think about what the linear probability model might be outputting.
This will be interpreted as saying there is a 20% probability that a student who drinks for 18 days out of 30 days will have an overdraw in his bank account.
Interpret the intercept of the model.
From the intercept, we can conclude that there is a 9% probability that a student in the population will have an overdraw when every other condition remains constant.
Interpret the slope of the model.
Since the slop was computed to be equal to 0.006225, we can conclude for a unit increase in the number of days a student drinks, the probability of bank overdraw will increase by 0.6225%
But maybe the relationship identified here isn’t causal. Lots of things correlate with both these irresponsible behaviors. Maybe binary sex (male = 0, female = 1), again with apologies to our non-binary friends), for example – we tend to think of men as engaging in more irresponsible behavior in pretty much every aspect of life.
Name and illustrate this potential issue using a DAG.
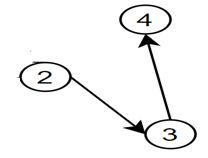
Sex =2
DaysDrink = 3
Overdrawn = 4
• Here are the results from a model adjusting for sex:
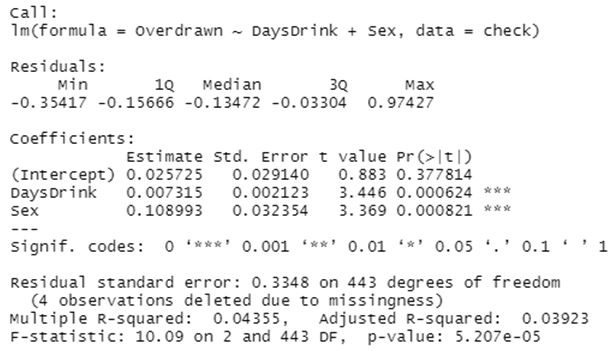
• Interpret the coefficient for sex above. Keep in mind its role in the model – and also that it may not show what we expected at first.
As observed, there is a significant effect of sex on the probability of overdraw which serves as a confounding factor due to its significant effects on the number of days a person will drink.
• Based on the output of the two models, was sex a substantial confounder of our exposure-outcome association?
Yes, sex is a substantial confounder of the exposure-outcome association
• What would the model predict, numerically, about the checking account overdraft history of a woman who never drank in the last month?
The model is likely to predict a low likelihood of checking account overdraft history of a woman who never drank in the last month
• The following questions have to do with difference-in-difference (DiD), regression discontinuity (RDD), and instrumental variable (IV) study designs.
• In your own words (about 2-3 sentences), explain the role these clever designs, as a group, fill. HINT: They’re a compromise between something we’d often like to do but can’t, and an easier option that has a big limitation.
Difference-in-Differences (DiD), regression discontinuity (RDD), and instrumental variable (IV) study designs are some of the most frequently used methods in impact evaluation studies. Based on a combination of before-after and treatment-control group comparisons, the method has an intuitive appeal and has been widely used in economics, public policy, health research, management, and other fields.
• For each of the following scenarios: which of the designs (DiD, RDD, IV) would be most applicable, and in about 1-2 sentences briefly explain how you would construct such a study.
• A group of physicians staffing a hospital’s emergency department (ED) has a strict policy of not running expensive tests to detect a heart attack in anyone under 40 (BONUS: hello, left digit bias!) until they’ve ruled out other potential causes for chest pain. A researcher is interested in the impact of early heart attack intervention in the ED on survival.
The Instrument Variable regression is most applicable in this scenario because the researcher is interested in the impact of early heart attack intervention in the ED on survival using test results as the instrumental variable.
• Part of the Affordable Care Act (U.S. healthcare reform bill passed in 2009) was funding for states to expand Medicaid (a health insurance program for the poor) if they so chose to start in 2014. Some states did, but others didn’t. A researcher is interested in the effect of that Medicaid expansion on medical bankruptcy rates.
The Difference-in-Difference regression is most applicable in this case because the researcher is interested in the effect of that Medicaid expansion on medical bankruptcy rates
• Answer the questions below. The answers in each part should be related to the same broader issue.
• Identify a key piece of information missing from this statement: The U.S. space shuttle program has blown up 2 times (Challenger in 1986, Columbia in 2007).
The key piece of information missing from this statement is the time of the event
• The annual rate of new cases of ovarian cancer is about 11.2 per 100,000 women HYPERLINK "https://seer.cancer.gov/statfacts/html/ovary.html"n. I do some quick math and estimate that, with approximately 330,000,000 people in the U.S., there should be about 37,000 cases of ovarian cancer per year – but it turns out there aren’t anywhere near that many. Why not, and why do you think the initial statistic (11.2 per 100,000 women) is reported specifically the way it is? A full answer will address both points and note the choice between, say, 11.2 per 100,000 vs. 112 per 1,000,000 is interesting but not what I’m after here.
Researchers came to this conclusion looking at a large number of patients, using pooled data from 252,745 US women with a median age of 57 years. Of those women, 38% said that they used powder in their genital area, 10% said they had been doing so for at least 20 years and 22% reported using it at least once a week.
• You work in a battery manufacturing plant. 0.5% of the batteries you produce on the assembly line are duds (they don’t work). Of course, no one would buy a battery where 1 in 200 didn’t work. So you have quality control (QC) procedures that filter out 90% of the bad batteries, though also 1% of the good ones. You only sell the batteries that pass that procedure.
Consider a production run of 100,000 batteries before quality control testing.
• How many batteries coming off the assembly line (before quality control testing) are duds? Show your work. (1 pt)
Given that 0.5% of the batteries produced are observed to be dud before quality control testing, it is expected that 0.005*100000 batteries which are equal to 500 batteries coming off the assembly line (before quality control testing) are duds will be dud
• What is P(QC catches | dud)?
P(QC catches | dud)=(0.9*500)/100,000=450/100,000 = 0.0045
• A battery manufacturing consultant comes in and asks why you’re throwing away all the batteries that fail the QC process. Why not send them for further testing first? You’re probably throwing out a lot of good ones! Is the consultant right? Explain your thinking with some calculations and a 1-sentence explanation.
The consultant might be right given that P(QC catches | dud)
You must Calculate at least one relevant conditional probability not provided in the prompt, but if you still disagree with the consultant it’s OK to make an argument separate from it.
NOTE: with the correct reasoning, I will accept either agreeing or disagreeing with the consultant!
P(QC catches | dud) prime = 1- P(QC catches | dud)
which is equal to 1-0.0045=0.9955. This implies that there is a 99% probability that the company might be throwing out good batteries that are not dud with given their method of selection