Problem Statement:
You are provided with a dataset containing information about mothers and their children. In this data analysis using STATA homework you are tasked with extracting valuable insights from the data. The goal is to answer several questions and present your findings in a visually appealing manner.
Solution
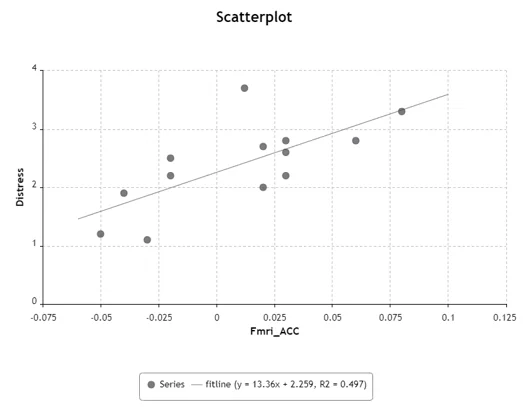
Answer 2: Scatter plot
Answer 3: 205 mothers have at least one daughter
distinct count_mother if sex==2
| Information | Total | Distinct |
|---|---|---|
| count_mother | 329 | 205 |
Answer 4: 127 mothers have exactly one daughter
distinct motherID if femalecount==1
| INFORMATION | TOTAL | DISTINCT |
| motherID | 127 | 127 |
Answer 5: 140 girls are the oldest child
tab old_sib_girl
| Old_Sib_girl | Freq. | Percent | Cum. |
| 1 | 140 | 100.00 | 100.00 |
| Total | 140 | 100.00 |
Answer 6: 205 girls are the oldest daughter.
distinct motherID if femalecount>=1
| INFORMATION | TOTAL | DISTINCT |
| motherID | 329 | 205 |
Answer 7: 25 years is the largest age gap between siblings in the data
tab age_gap
| age_gap | Freq . | Percent | Cum . |
|---|---|---|---|
| 0 | 109 | 15.31 | 15.31 |
| 1 | 8 | 1.12 | 16.43 |
| 2 | 14 | 1.97 | 18.4 |
| 3 | 33 | 4.63 | 23.03 |
| 4 | 33 | 4.63 | 27.67 |
| 5 | 51 | 7.16 | 34.83 |
| 6 | 64 | 8.99 | 43.82 |
| 7 | 36 | 5.06 | 48.88 |
| 8 | 28 | 3.93 | 52.81 |
| 9 | 43 | 6.04 | 58.85 |
| 10 | 25 | 3.51 | 62.36 |
| 11 | 39 | 5.48 | 67.84 |
| 12 | 32 | 4.49 | 72.33 |
| 13 | 17 | 2.39 | 74.72 |
| 14 | 26 | 3.65 | 78.37 |
| 15 | 24 | 3.37 | 81.74 |
| 16 | 10 | 1.4 | 83.15 |
| 17 | 30 | 4.21 | 87.36 |
| 18 | 6 | 0.84 | 88.2 |
| 19 . | 18 | 2.53 | 90.73 |
| 20 | 4 | 0.56 | 91.29 |
| 21 | 23 | 3.23 | 94.52 |
| 22 | 7 | 0.98 | 95.51 |
| 23 | 7 | 0.98 | 96.49 |
| 24 | 17 | 2.39 | 98.88 |
| 25 | 8 | 1.12 | 100 |