Problem Description
For this SPSS homework, we were tasked with analyzing an online survey dataset related to loyalty programs. The dataset included various variables, and we were required to answer specific questions using the dataset and, where applicable, provide SPSS or PSPP output to support our answers.
Solution
Using the data set provided (An on-line survey conducted on loyalty programs; the description of variables can be found in the file, under Variable View - label and values), please answer the items below. You can download the data file from CANVAS. You should aim to respond to all items. The document that you create should include the answers to the questions and any relevant SPSS or PSPP output.
1. What is the type of scale used to measure variables Income, Household_composition, Membership_length, Education? Nominal, Ordinal, Interval, or Ratio?
Income - Ordinal
Household Composition - Ratio
Membership Length - Interval
Education - Nominal
2. How many respondents (actual number of respondents) have been in the loyalty program for more than 5 years?
485
3. What percentage of all respondents have been in the loyalty program for less than 3 years?
11.8
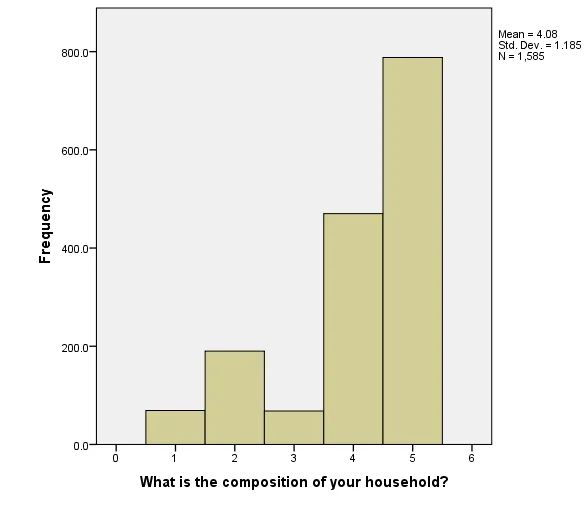
4. Draw a bar graph that shows the number of respondents for each answer to the variable
Household_composition.
5. What are the mean, mode and median of variables Likeability_LP and Gender?
| Likeability_LP | Gender | ||
|---|---|---|---|
| N | Valid | 1585 | 1585 |
| Missing | 0 | 0 | |
| Mean | 3.37 | 1.63 | |
| Median | 3.00 | 2.00 | |
| Mode | 3 | 2 | |
6. What are the mean, range and standard deviation of variable Likeability_points?
| N | Valid | 1585 |
|---|---|---|
| Missing | 0 | |
| Mean | 3.37 | |
| Std. Deviation | .972 | |
| Range | 4 | |
7. Save the standardized scores (Z-scores) of Likeability_points as a new variable.
a) What is the score of respondent 5 (every respondent has an ID) on the newly generated variable (standardized scores of Likeability_points)?
.65180
b) What is the unit of measurement for the newly generated variable (standardized scores of Likeability_points)?
Standardized values have no units
8. Is variable Gender associated with variable Education? State the null (H0) and the non-directional alternative hypothesis (H1). Choose an appropriate test given the type of scale with which the variables are measured. Show the result of the statistical test that you use and draw the conclusion.
9. Calculate and interpret (significance, direction) the correlation coefficient between variables Likeability_LP and Likeability_points. Calculate and interpret the coefficient of determination.
Correlationsb
| I like participating in loyalty programs | I like saving points or stamps | ||
|---|---|---|---|
| I like participating in loyalty programs | Pearson Correlation | 1 | .583** |
| Sig. (2-tailed) | .000 | ||
| I like saving points or stamps | Pearson Correlation | .583** | 1 |
| Sig. (2-tailed) | .000 | ||
**. Correlation is significant at the 0.01 level (2-tailed).
b. Listwise N=1585
The correlation coefficient between Likeability_LP and Likeability_points is 0.583. The correlation is positively moderate correlated.
10. Consider the following regression model. Dependent variable: Membership_length. Independent variables: LP_consequence and Gender.
a) What is the value of the R-Square? Interpret the R-Square.
Model Summary
| Model | R | R Square | Adjusted R Square | Std. Error of the Estimate | Change Statistics | ||||
|---|---|---|---|---|---|---|---|---|---|
| R Square Change | F Change | df1 | df2 | ||||||
| 1 | .059a | .003 | .002 | 1.039 | .003 | 2.746 | 2 | 1582 | |
a. Predictors: (Constant), What is your gender?, Because you participate in the LP, is it more or less likely that you remain customer at this company?
The value of R-Squared is 0.003 meaning that only 0.3 of the Membership length is explained by LP_Consequences and gender
b) Is the regression model significant as a whole?
ANOVAa
| Model | Sum of Squares | df | Mean Square | F | Sig. | |
|---|---|---|---|---|---|---|
| Regression | 5.927 | 2 | 2.963 | 2.746 | .065b | |
| Residual | 1707.442 | 1582 | 1.079 | |||
| Total | 1713.369 | 1584 | ||||
a. Dependent Variable: How many years have you been participating in this loyalty program?
b. Predictors: (Constant), What is your gender?, Because you participate in the LP, is it more or less likely that you remain customer at this company?
From the SPSS output above, the p value is 0.065 which is greater than the p_critical (0.05) indicating that the model is not significant.
c) What are the values of the regression coefficients?
Coefficientsa
| Model | Unstandardized Coefficients | Standardized Coefficients | t | Sig. | ||
|---|---|---|---|---|---|---|
| B | Std. Error | Beta | ||||
| (Constant) | 3.863 | .127 | 30.508 | .000 | ||
| Because you participate in the LP, is it more or less likely that you remain customer at this company? | -.070 | .035 | -.049 | -1.968 | .049 | |
| What is your gender? | .065 | .054 | .030 | 1.196 | .232 | |
a. Dependent Variable: How many years have you been participating in this loyalty program?
LP_Consequences – -0.070
Gender – 0.065
d) Are the regression coefficients of LP_consequence and Gender statistically significant?
From the table in the previous question the p-value of LP_Consequences is 0.049 which is below the critical p-value hence the coefficient of LP_Consequences is significant. The p value for Gender is 0.232 which is greater than the critical p value hence the regression coefficient for gender is not significant.
e) Provide the interpretation of the regression coefficients of LP_consequence and Gender.
LP_Coefficients
The coefficient of LP_Cosequence is -0.070 indicating that an increase in one unit of LP_Consequences will result into a decrease in Membership length by 0.070 units.
Gender
The coefficient of Gender is 0.065, being male has an advantage in membership length by 0.065 units.
11. Make correction(s) as necessary to the draft question below, restating the amended question in a form appropriate for the finalised questionnaire.
How much do you spend on socialising whilst at university?
< £10 £10 to £20 £20 to £30 £30 to £40 £40 or more
On average how many hours per week do you spend socializing while at the University?
<10 hours 10hours to 20 hours 20hours to 30 hours 30hours to 40hours 40hours or more
12. ACompany Ltd plans to conduct further research into levels of absenteeism among its workforce and the factors which may influence absenteeism levels. From academic studies it is known that a range of factors have an influence, including level of happiness/ satisfaction with production targets imposed by management.
1, 2, 3, 4
Happy , Extremely Happy
Q: On a scale of 1 (Extremely Unhappy) to 5 (Extremely happy), how happy are you with the current production targets imposed on you by management?
Q: On a scale of 1 (Happy) to 4 (Extremely happy), how happy are you
with the current production targets imposed on you by management ?
1, 2, 3 4, 5
Extremely Unhappy Unhappy, Moderate, Extremely Happy
Make correction(s) as necessary to the draft question above, restating the amended question in a form appropriate for the finalised questionnaire.