Problem Description:
In this Statistical Analysis homework solution, we aim to explore the influence of computer knowledge pretest scores, trait anxiety pretest scores, and the age of students on their computer anxiety posttest scores. The dataset consists of 86 observations, and we will employ various statistical techniques to understand the relationships and predict computer anxiety posttest scores based on these variables.
Solution
Table 1: Descriptive Statistics
Descriptive Statistics
| Mean | Std. Deviation | N | |
|---|---|---|---|
| Computer Anxiety Posttest | 46.84 | 11.045 | 86 |
| Computer Knowledge Pretest | 9.02 | 5.943 | 86 |
| Trait Anxiety Pretest | 38.53 | 9.580 | 86 |
| Student age | 23.66 | 5.485 | 86 |
Table 1 contains the descriptive statistics of the variables contained in the model. On the average, Computer Anxiety Posttest is 46.84 with a standard deviation of 11.04 (M=46.84, SD=11.04), Computer Knowledge Pretest is 9.02 with a standard deviation of 5.94 (M=9.02, SD=5.94), Trait Anxiety Pretest is 38.53 with a standard deviation of 9.58 (M=38.53, SD=9.58) and the age of student is 23.66 with a standard deviation of 5.49 (M=23.66, SD=5.49). Computer Anxiety Posttest has the highest mean and standard deviation while Computer Knowledge Pretest has the lowest mean. Although, the less varied variable is student age.
Table 2: Correlation Matrix
Correlations
| Computer Anxiety Posttest | Computer Knowledge Pretest | Trait Anxiety Pretest | Student age | ||
|---|---|---|---|---|---|
| Pearson Correlation | Computer Anxiety Posttest | 1.000 | -.439 | .489 | -.047 |
| Computer Knowledge Pretest | -.439 | 1.000 | -.012 | -.051 | |
| Trait Anxiety Pretest | .489 | -.012 | 1.000 | -.148 | |
| Student age | -.047 | -.051 | -.148 | 1.000 | |
| Sig. (1-tailed) | Computer Anxiety Posttest | . | .000 | .000 | .334 |
| Computer Knowledge Pretest | .000 | . | .458 | .322 | |
| Trait Anxiety Pretest | .000 | .458 | . | .087 | |
| Student age | .334 | .322 | .087 | . | |
| N | Computer Anxiety Posttest | 86 | 86 | 86 | 86 |
| Computer Knowledge Pretest | 86 | 86 | 86 | 86 | |
| Trait Anxiety Pretest | 86 | 86 | 86 | 86 | |
| Student age | 86 | 86 | 86 | 86 | |
The correlation matrix reveals that the dependent variable Computer Anxiety Posttest has a positive and significant correlation with Trait Anxiety pretest (r=0.489, p<0.01) and has a negative and significant correlation with Computer Knowledge Pretest (r=-0.439, p<0.01). However, it has a negative and insignificant correlation with the age of student (r=-0.047, p=0.334). The correlation coefficients among the independent variables are negative and insignificant as displayed in the table.
Null hypothesis: H_0: β_1=β_2=β_3=0
The linear combination of computer knowledge pretest score, trait anxiety pretest score, and age cannot statistically significantly predict scores on the computer anxiety posttest.
Table 3: Summary of the model
Model Summary
| Model | R | R Square | Adjusted R Square | Std. Error of the Estimate | Change Statistics | Durbin-Watson | ||||
|---|---|---|---|---|---|---|---|---|---|---|
| R Square Change | F Change | df1 | df2 | Sig. F Change | ||||||
| 1 | .489a | .239 | .230 | 9.690 | .239 | 26.434 | 1 | 84 | .000 | |
| 2 | .654b | .427 | .413 | 8.461 | .188 | 27.191 | 1 | 83 | .000 | 2.193 |
Table 3 contains model summary of both models but model 2 is of great importance since it contained more significant variables and these variables in model 2 explained more of the variation in the Computer Anxiety Posttest than Model 1. Model 2 has a coefficient of determination known as R-squared is 0.427 and this implies that 42.7% of the total variation in the dependent Variable are jointly explained by the explanatory variables in the model.
Table 4: Analysis of variance table
ANOVA
| Model | Sum of Squares | df | Mean Square | F | Sig. | |
|---|---|---|---|---|---|---|
| 1 | Regression | 2482.158 | 1 | 2482.158 | 26.434 | .000b |
| Residual | 7887.563 | 84 | 93.900 | |||
| Total | 10369.721 | 85 | ||||
| 2 | Regression | 4428.525 | 2 | 2214.263 | 30.934 | .000c |
| Residual | 5941.196 | 83 | 71.581 | |||
| Total | 10369.721 | 85 | ||||
- Dependent Variable: Computer Anxiety Posttest
- Predictors: (Constant), Trait Anxiety Pretest
- Predictors: (Constant), Trait Anxiety Pretest, Computer Knowledge Pretest
Table 5: Regression Coefficients
Coefficients
| Model | Unstandardized Coefficients | Standardized Coefficients | t | Sig. | Correlations | Collinearity Statistics | |||||
|---|---|---|---|---|---|---|---|---|---|---|---|
| B | Std. Error | Beta | Zero-order | Partial | Part | Tolerance | VIF | ||||
| 1 | (Constant) | 25.101 | 4.355 | 5.764 | .000 | ||||||
| Trait Anxiety Pretest | .564 | .110 | .489 | 5.141 | .000 | .489 | .489 | .489 | 1.000 | 1.000 | |
| 2 | (Constant) | 32.590 | 4.064 | 8.018 | .000 | ||||||
| Trait Anxiety Pretest | .558 | .096 | .484 | 5.828 | .000 | .489 | .539 | .484 | 1.000 | 1.000 | |
| Computer Knowledge Pretest | -.805 | .154 | -.433 | -5.215 | .000 | -.439 | -.497 | -.433 | 1.000 | 1.000 | |
Dependent Variable: Computer Anxiety Posttest
Table 4 & 5 above contain the analysis of variance and regression coefficients respectively. The results presented in the table above shows that the model is statistically significant F(2,83) = 30.934, p < 0.01, the intercept of model 2 is 32.59 and this implies that the expected Score of Computer Anxiety Posttest is 32.59 when all the explanatory variables are held constant or set to zero. The coefficient of Trait Anxiety Pretest is 0.558 and this implies that a unit increase in the score of Trait Anxiety Pretest will lead to a 0.558 increase in the score of Computer Anxiety Posttest while Computer Knowledge Pretest is held constant. Finally, the coefficient of Computer knowledge pretest is -0.805 and this implies that a unit increase in the score of Computer Knowledge Pretest will lead to 0.805 decrease in the score of Computer Anxiety Posttest while Trait Anxiety Pretest is held constant. Age of student was excluded from the model because it has no significant impact on Computer Anxiety Posttest.
The best fitted model is model 2 which is presented in the equation below:
comanx2: β_0+β_1*traitanx+β_2*comknow
comanx2: 32.590+0.558*traitanx-0.805*comknow
Among the assumptions of multiple linear regression model are Linearity, Independence, Multicolinearity, Normality, absence of outliers and Homoscedasticity. Both the normal probability plot and the histogram presented in Figures 1 & 2 show that the dependent Variable Computer Anxiety Posttest is roughly normally distributed. Also, the Collinearity Statistics presented in table 5 shows that there is no multicolinearity among the independent variables as none of the VIF is above 1.
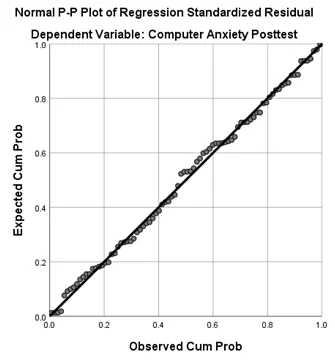
Figure 1: Normal probability plot
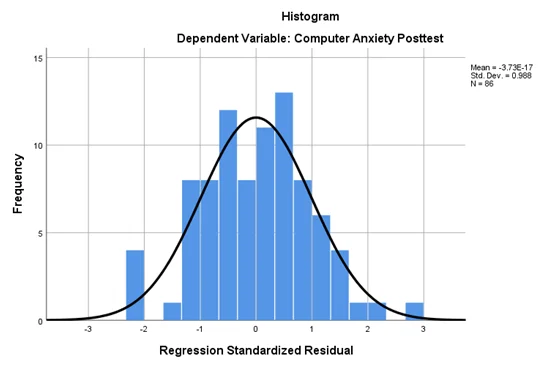
Figure 2: Histogram of the standardized residual