Data and T-Test correlation
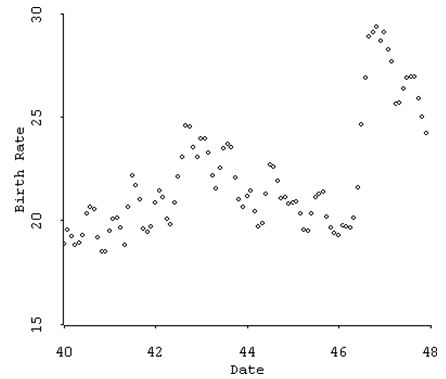
1. Above is the monthly birthrate (per 1,000 US populations) from 1940-1947. A total of n=96 months are represented. Let ρ be the correlation between birth rate and time.
The sample correlation is r=0.6191. Test at the 0.05 significance level the null hypothesis H0: ρ=o versus HA: ρ≠o. Report the test statistic and P-value.
We shall conduct a t-test:
t=(r√(n-2))/√(1-r^2 )= 7.643326
The t-statistic has degrees of freedom n-2.
p-value=8.89×〖10〗^(-12)
Hence, we reject H0 in favor of alternative, and hence, we conclude that correlation is statistically significant.
Is there an overall linear trend in the data? What does the positive correlation coefficient indicate in terms of the trend in birth rates over time?
There is an overall trend in the data, but it is not linear. There are two shapes and the part-wise linear line can be fitted.
Describe two non-linear trends in the data and what might be the demographic historical causes of those nonlinear trends.
The trend we see is increasing from 40-43 then decreasing till1946. Then a sharp increase. This may be due to the world war going around at the time.
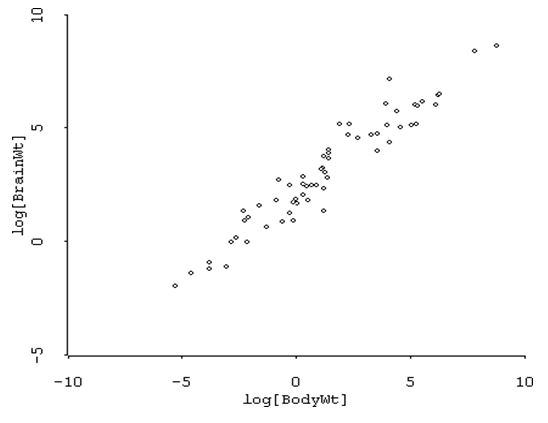
The plot above shows the brain weight (grams) versus body weight (kilograms) of n=62 species of mammals. Both variables have been transformed to the log scale. Define the regression model
y=α+β*𝓍+e,
'where y is the log(BrainWt), x is log(BodyWt), and e is random error.
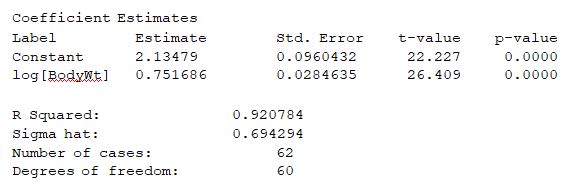
a. According to the regression model from the computer output, what is the average change in the log(BrainWt) associated with an increase of one unit in the log(BodyWt)?
The regression model is:
(log(BrainWt)) ̂=2.13479+0.751686×log(BodyWt)
b. According to the regression model, what is the average brain weight for a 59kilogram mammal?
log(brain wt)= 2.13479+0.751686×log〖(59)=5.2〗
Hence, brain wt=181.27gms
c. Test the null hypothesis that β=0 versus the alternative β≠0 at the 0.05significance level. Give the test statistic, degrees of freedom, p-value, and your conclusion.
We can carry out t-test
t=β ̂/se(β) =0.751686/0.0284635= 26.40877
The test statistic has a t-distribution with 60 degrees of freedom.
P-value is < 0.0001
Conclusion: The body weight can significantly predict brain weight and the strength of the linear relationship between them is statistically significant.