Problem Description:
This Statistical Analysis homework focuses on the central question in real estate, whether property prices are primarily determined by the size of the property in square feet. While several factors influence property prices, the geographical region is one of the critical variables to consider. This study aims to investigate whether the average cost per square foot of properties is the same or significantly different between the Mid-Atlantic and South Atlantic regions. To address this question, we employed a two-tailed t-test to examine our hypothesis.
Solution
Introduction
We took 375 observations randomly from mid-Atlantic and South Atlantic regions. Hence, the total number of data points were 750. We used the two-sample two-tailed t-test.
Setup
The population parameter is average cost per square feet in the region. The hypotheses is specified as:
- H0: There is no significant difference between average cost per square feet in Mid-Atlantic and South Atlantic, μ_1= μ_2.
- H1: There is significant difference between average cost per square feet in Mid-Atlantic and South Atlantic, μ_1≠μ_2.
A two-sample two tailed t-test was used to test the said hypothesis.
Data Analysis Preparations
The sample contains 750 data points – 350 from mid-Atlantic region where average cost per square foot was 135.64 (SD = 134.4) and 350 from south Atlantic where average cost per square foot was 132.56 (SD = 62.15)
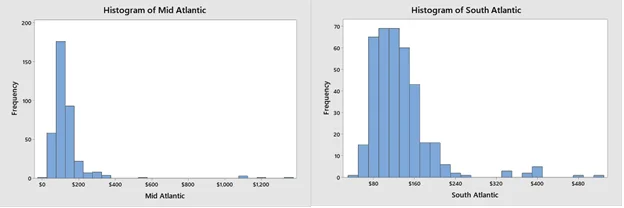
The histogram for both mid-Atlantic and south Atlantic cost per square foot indicates right skewed. Hence, the normal distribution assumption might not be met.
The assumptions for the two-sample t-test are:
- Normality of the data: This assumption is not satisfied based on Shapiro Test for normality for both the groups, p <.001 for both the groups.
- Independence: The samples can be assumed to be independence by construction
- Equality of variance: This assumption is also not met based on Levene’s Test, p=.04; hence, the variance in two groups is not same.
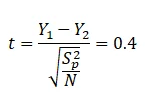
The t-test statistic is calculated as:
Calculations
The test-statistic has t-distribution with 748 degrees of freedom. The two-tailed p-value is P(|t(748)|>0.4)=0.69
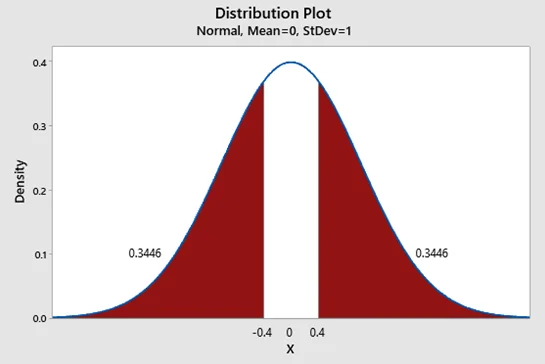
Figure 1: Representation of test on normal curve. As degrees of freedom is high, t is nicely approximated by normal distribution.
Test Decision
The p-value is the probability of type 1 error if null hypothesis is true. The two tailed p-value for this test is 0.69 which is larger than the level of significance which is 5%. The shaded area in below plot indicates the probability of null hypothesis being true.
Since, p-value is larger than the level of significance, we do not reject the null hypothesis.
Conclusion
It was concluded that the average cost per square foot was same for both mid-Atlantic and south Atlantic regions as there was no evidence of significant difference in the data. The test assumptions were not fully satisfied; hence, the test result may be less reliable. A non-parametric test can be done to further analyze the difference. However, based on t-test and descriptive statistics, we conclude that there is no significant difference in cost per square foot in two regions.