Hypothesis Tests and Errors
Learn how to conduct hypothesis tests like the independent sample T-test and the Chi-square test, make correct decisions on hypotheses, and identify errors associated with hypothesis tests by going through our solutions below. If you need solutions that are clean, straight to the point, and correct, we can craft them for you at affordable rates online.
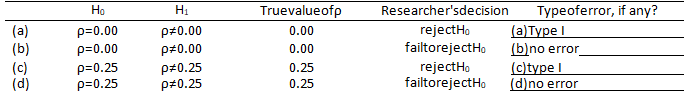
1. In each instance indicate whether a Type I error, a Type II error, or no error was committed by the researcher. Note that Ho: ρ = 0.00 is the standard null hypothesis (i.e., no linear relationship, the correlation does not differ from 0.00) for a Pearson’s correlation, although other versions of Ho are possible such as Ho: ρ = 0.25 (i.e., the correlation does not differ from 0.25).
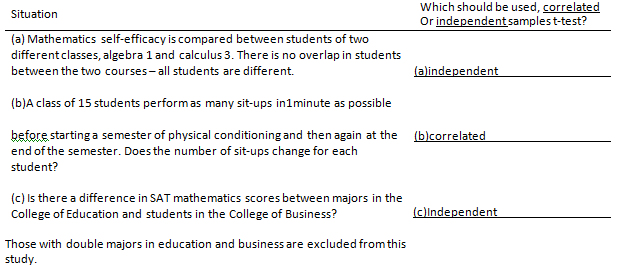
For each of the following, identify whether correlated samples t-test or independent samples t-test should be used.
2. Power, the probability of rejecting a false null, is greatest for which one of the following? Select the correct response.
a.power(1–β)=.95 c.power(1 –β)=.05
b.power(1 –β) =.90 d.power(1–β) =.01
important note
For the remaining items, you are to create an APA-styled results presentation. This will include a table of results, and written inference and interpretation. If you are unclear about APA styled tables, review carefully the examples provided in the linked Word document on the Course Index.
3. Below are Test 1 scores for EDUR 8131 for students enrolled during Spring 2013 and Spring 2012.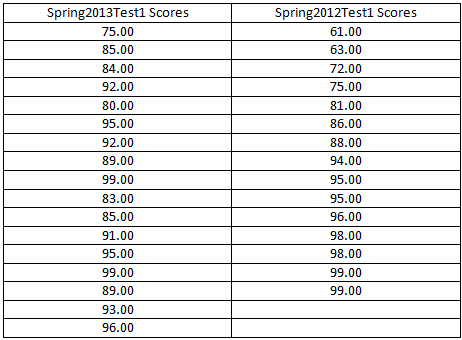
Double-check your data entry to ensure no entry errors.
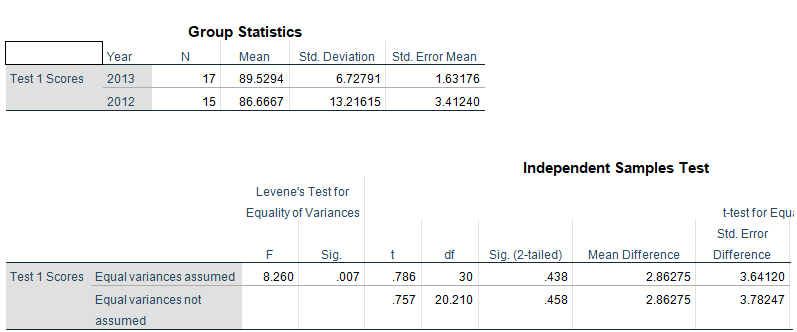
Is there any evidence that Test 1 scores differed between students enrolled in Spring 2013 and Spring 2012? Report results in APA style (APA style results table, and APA style written inference and interpretation). Use independent samples t-test for these data.
Ans: There was no significant difference in the means between Test 1 scores of 2013 (M=89.5294, SD= 6.7279) and Test 1 scores of 2012(M=86.6667, SD=13.2162) as t(20) = 0.757, p=0.458.
Results:
4. Doug Stirling of the Massey University reports the following data.
“Urine drug screening was performed on 2542 applicants for career craft positions in the US Postal Service's Boston Management Sectional Center…Those testing positive for more than one drug were classified under the more serious of the drugs, so each individual only contributed to a single cell in the table.” The table below shows the results of drug screening by sex of the applicant. Is there any evidence that the four screening results differ by applicants’ sex?
Report results in APA style (APA style results table, and APA style written inference and interpretation). Use Chi-square Test of Association for these data.

Ans: There is a significant association between Gender and drug. Females are more likely to be tested negative, χ^2 (3, N=2542)=14.073,p=0.003.
Result:
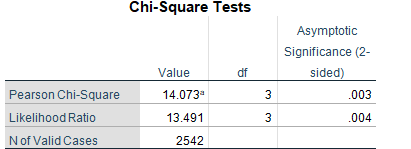
a. 0 cells (0.0%) have an expected count of less than 5. The minimum expected count is 18.82.