Testing Null and Alternate Hypothesis
1) There is a market research group called “The international Consortium for Coffee Advocates” which puts out a yearly report. The organization puts out a report saying that the average price of coffee from 1991 to 2018 is 3 dollars. You do not believe this is true, so you go out and gather data on the price of a coffee per year from 1991 to 2018. The question below is worth 3 points.
i. What is the null and alternative hypothesis described above?
ii. Use an alpha of .05 to calculate the Critical Value and The test statistic for the question above.
iii. Do I reject the null hypotheses or not? You also gathered data on the quantity of coffee imported to America and the price of tea per year in America.
You want to include a final X value called Trend; it is just a number from 1-28 and measures the growth effects over time of coffee import. This is a common method when working with time-series data. (I want you to estimate this model Coffee Import = B (price of a coffee) +B (the price of tea) +B (Trend))
a. Use a program to estimate the regression model for the data? (Write it out in your answer)
b. What does the model say about the relationship between the price of coffee and the number of coffee beans imported? Is it positive or negative? How about the price of Tea? Does it impact the amount of coffee imported? Please interpret the main statistics of interest, what can you include about the model? (R-Squared, adjusted R-Squared, and P-Values). Does the model explain the data variation?
2) In the 1990s the department of wildlife in New York did a massive survey of the animal distribution of the local forests. The data are randomly collected from the forests. They found that the distribution of animals as a total percentage is as follows:
| Animals | Percentage |
| Deer | 40% |
| Cougar | 05% |
| Black Bear | 10% |
| Squirrel | 15% |
| Otter | 10% |
| Moose | 03% |
| Fox | 07% |
| Other | 10% |
Now in 2020, they decided to redo the survey and counted 10000 animals. The results of the survey are listed below:
| Animals | Percentage |
| Deer | 3700 |
| Cougar | 600 |
| Black Bear | 1000 |
| Squirrel | 1500 |
| Otter | 1100 |
| Moose | 400 |
| Fox | 700 |
| Other | 1000 |
The government thinks that the distribution of animals has not changed between 1990 and 2020. Use an alpha of .10 to answer the following questions:
i. Does the new survey indicate that the distribution of animals is the same as the one given in the old survey? Please list the Null and Alternative hypotheses?
ii. What are the conditions required to perform the hypotheses test?
iii. What is the critical value for this distribution?
iv. What is the test statistic for our sample?
v. Do we reject or accept the null hypotheses of the data above? Please explain within the context of the question.
Solution:
Question 1:
Part 1:
According to the given data, we have
Let μ = true average price of coffee since the data is from 1997 – 2018
Null Hypothesis: H_0:μ=3
alternative hypothesis: H_1:μ≠3
Critical value = t_0.025,27=2.05
The test statistic
t= (√n (x ̅-μ))/S=4.70
n=sample size=28
x ̅=sample mean=3.769
S=sample standard deviation=0.865
Therefore, we reject the null hypothesis at a 5% level of significance since the absolute value of t > critical
Part 2:
Last year's data (i.e. 2017 and 2018) are incomplete/missing, hence we cannot compute a regression model using this data set.
Question 2:
We have to test if the distribution of animals in 2020 is the same as that of 1990
i) Hypothesis to be tested are
Null hypothesis H0: New survey (2020) indicates that the distribution of animals is the same as the one given in the old survey(1990)
Alternative hypothesis H1: New survey(2020) indicates that the distribution of animals is different than that of the old survey(1990)
ii) Conditions required for the test of hypothesis are
a) Observations sampled are should be independent i.e. the sampling method is simple random sampling.
b) Expected frequency should be greater than or equal to 5
iii) Critical value,
Given the level of significance = 0.10
Let Chrt be the critical value
Therefore
P( >Chrt)= 0.10 where is the chi-square variable having 8 (number of k-1= 8-1=7 degrees of freedom ,k: number of types of animals
But
P( > 12.02)= 0.10
Therefore critical value = Chrt = 12.02
iv)
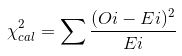
Test statistics,
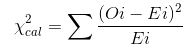
where,
Oi: Observed frequency i.e. observed number of a particular type of animal in a new survey of 2020
Ei: Expected frequency i.e. expected number of a particular type of animal in an old survey of 1990
=10000*Pi
where Pi: Probability that particular type of animal in an old survey of 1990
Table for calculations
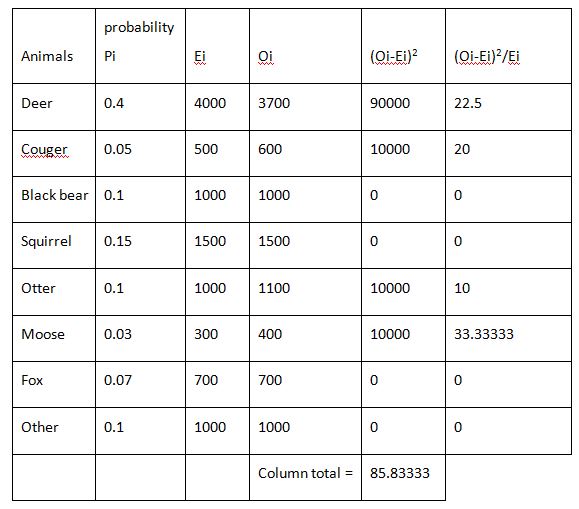
Test statistics,
= 85.83333
v)
As Critical value < Test statistics value
Reject H_0
Therefore, there is sufficient evidence to say that the New survey (2020) indicates that the distribution of animals is different than that of the old survey(1990)