Problem Description:
In this homework, we are analyzing a dataset to make inferences about proportions and test hypotheses. The data relates to HIV testing and the effect of a treatment on patient outcomes. We will calculate confidence intervals, perform hypothesis tests, and draw conclusions about the data.
Solution
Problem 1
a.
| X | 271 |
| n | 324 |
| p | 0.8364 |
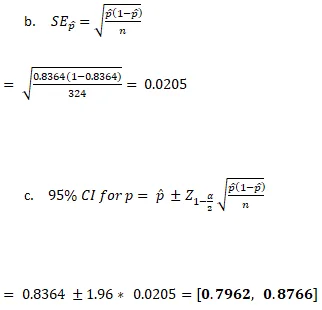
This implies that at 5% level of significance, we are confident that the sample proportion lies between 0.7962 and 0.8766

Level of significance: a= 0.05
e.
| Treatment | Control | Total | |
|---|---|---|---|
| HIV Positive | 13 | 40 | 53 |
| HIV Negative | 151 | 120 | 271 |
| Total | 164 | 160 | 324 |
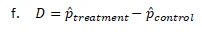
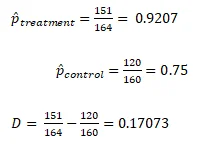
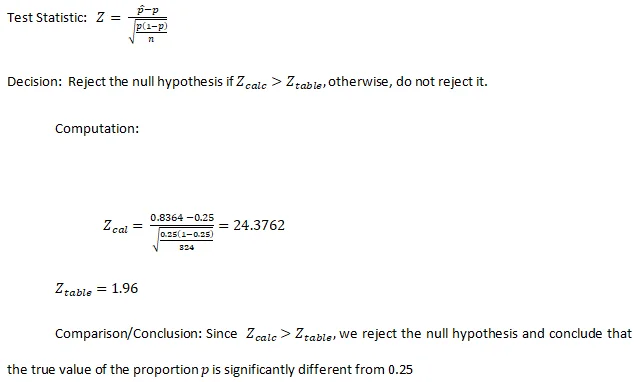
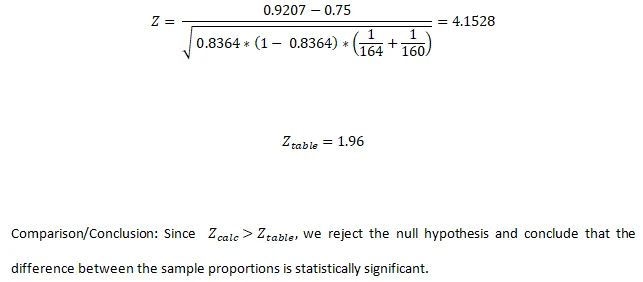
g.
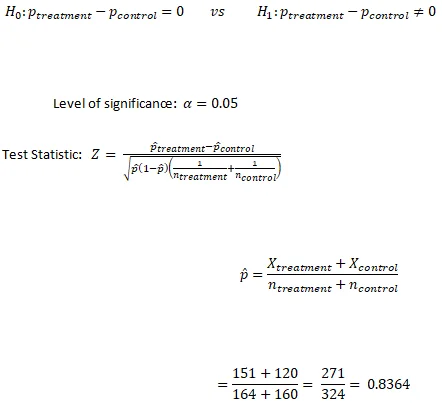

Computation:
h.
It is an experimental study. Treating it as a causal relationship means that one variable is believed to have effect or influence the outcome of another variable.
Problem 2
- 2 x 3 table
| Age | |||||
|---|---|---|---|---|---|
| Approval | 18-34 | 35-54 | 55+ | Total | |
| Approved | 68 | 128 | 173 | 369 | |
| Not approved | 164 | 204 | 165 | 533 | |
| Total | 232 | 332 | 338 | 902 | |
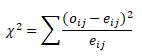
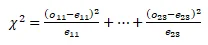
- Hypothesis:


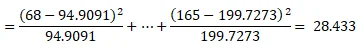
- Expected frequency
| Age | |||||
|---|---|---|---|---|---|
| Approval | 18-34 | 35-54 | 55+ | Total | |
| Approved | 94.9091 | 135.8182 | 138.2727 | 369 | |
| Not approved | 137.0909 | 196.1818 | 199.7273 | 533 | |
| Total | 232 | 332 | 338 | 902 | |
df = 2, p-value = 0.0000
reject the null hypothesis and conclude that there is an association between age of the respondent and approval of the “stop and frisk” policy.
- From the analysis carried out, there exists as association between the approval of the “stop and frisk” policy and age of the respondent. It is recommended that political activist consider age while approving police stop and frisk” policy since both are dependent.
Problem 3
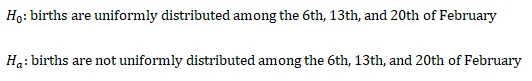
- Hypothesis:
- Expected count

| Dates | Counts | Probability | Expected counts | 2 |
|---|---|---|---|---|
| 6th | 315641 | 0.33333333 | 312340.33 | 34.8799 |
| 13th | 298749 | 0.33333333 | 312340.33 | 591.4201 |
| 20th | 322631 | 0.33333333 | 312340.33 | 339.0463 |
| Total | 937021 | 1 | 937021 | 965.3462 |
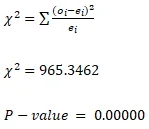
Since P-value is less than 5%, we reject the null hypothesis.
- Based on the goodness of fit carried out, we can conclude that people’s baby choices with respect to Fridays (6th, 13th, and 20th) are not equally likely.
Problem 4
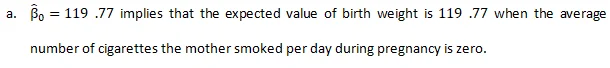
When the mother smokes 0 cigarettes/day
birth weight: 119.77-0.514*0=119.77
the predicted birth weight when the mother smokes 0 cigarettes/day is 119.77


When cigarettess/day=20
birth weight= 119.77-0.514*20= 109.49
When compared to part A, we noticed a decrease in the baby’s weight from 119.77 77 when no cigarette was smoked per day to 109.49 which is a reduction of 10.28 ounces when 20 cigarettes was consumed per day.
Yes, the regression results do capture a causal relationship between average number of cigarettes smoked by mother during pregnancy and infant birth weight. As the number of cigarettes consumed increases, infant birth weight decreases.
Mother’s weight is missing from the analysis as weight of mother during pregnancy also influence or tends to increase the baby’s weight.