Problem Description
In this data analysis homework, we performed an exploratory data analysis on a dataset that encompasses various variables related to students and lecturers. The primary goal was to uncover insights and relationships within the data. The homework is divided into several key questions and analyses.
Solution
Question 1: Exploratory Data Analysis.
a.
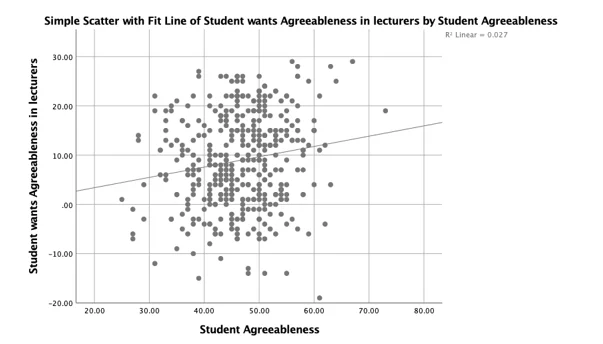
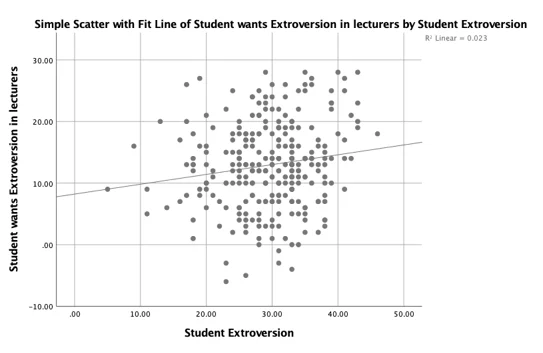
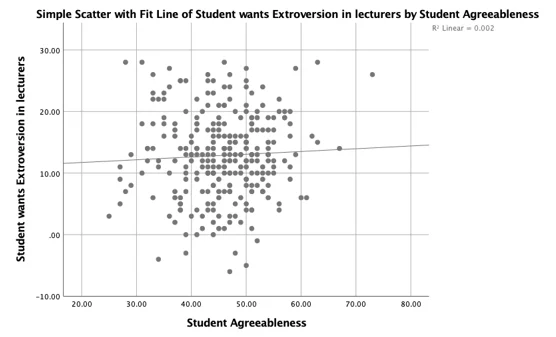
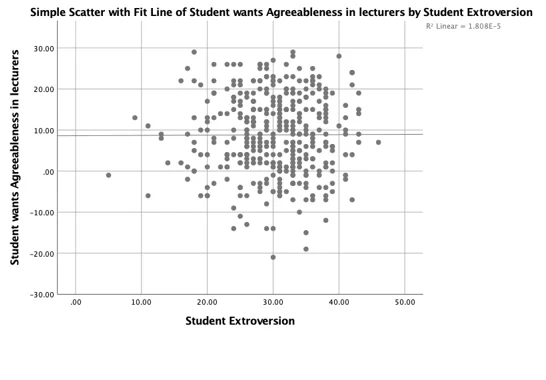
From the scatterplots above, there exist strong positive correlation between all the four dependent variables and the corresponding independent variables. In the first three plot, increase in the dependent variables correlated with increases in the dependent variables.
b.
Table 1: Exploratory Data Analysis on all variables in the data set.
| Data | Mean | Median | Variance | Std. dev | Std. err | Min | Max | Range | Skewness | Kurtosis |
|---|---|---|---|---|---|---|---|---|---|---|
| Age | 20.24 | 19 | 14.32 | 3.78 | .23 | 2 | 43 | 41 | 2.67 | 14.18 |
| Sex | ||||||||||
| Student N | 23.71 | 24 | 74.65 | 8.64 | 0.15 | 0 | 44 | 44 | -.02 | -.10 |
| Student E | 29.55 | 30 | 44.09 | 6.64 | .41 | 5 | 46 | 41 | -.45 | .49 |
| Student O | 28.97 | 29 | 38 | 6.16 | .38 | 14 | 44 | 30 | .14 | -.38 |
| Student A | 45.72 | 46 | 58.30 | 7.64 | .47 | 25 | 73 | 48 | -.08 | .39 |
| Student C | 29.62 | 30 | 47.45 | 6.89 | .42 | 7 | 45 | 38 | -.31 | .02 |
| Lecturer N | -21.6 | -24 | 92.40 | 9.61 | .59 | -30 | 25 | 55 | 2.06 | 5.75 |
| Lecturer E | 12.91 | 13 | 45.30 | 6.73 | .41 | -5 | 28 | 33 | -.00 | -.29 |
| Lecturer O | 8.02 | 8 | 64.55 | 8.03 | .49 | -15 | 30 | 45 | .11 | -.04 |
| Lecturer A | 7.63 | 7 | 90.7 | 9.52 | .59 | -19 | 29 | 48 | .02 | -.42 |
| Lecturer C | 16.88 | 17 | 58.93 | 7.68 | .47 | -8 | 30 | 38 | -.59 | .14 |
Question 2: Missing Values
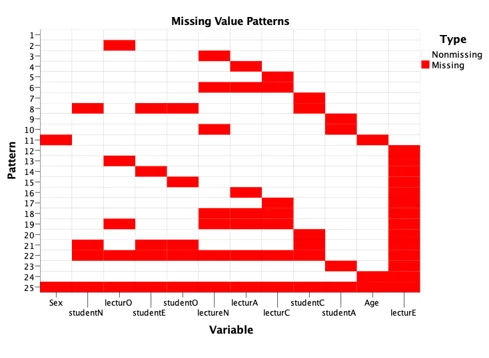
The p-value for the Little MCAR test was highly significant at 0.05 level of significance and this caused a rejection of the null hypothesis and concluded that the data are not missing completely at random but the Missing data pattern plot above showed no pattern in the missingness of the data therefore a multiple imputation technique will be used to replace the missing values randomly as this can produce statistically valid results in the instance of small or large amount of missing data.
Question 3: Correlation
a. One Tailed Testing will be used because the Pearson Product Moment formula measures the nature of relationship between two or more variables, either negative or positive. In order to decide whether the variables under study have a positive or negative correlation, a one-directional hypothesis testing should be adopted.
b.
- Pearson correlation coefficient was computed to assess the linear relationship between Students’ Extroversion and Lecturers’ Extroversion. There was a positive correlation between the two variables, r(425) = .19, p = .000.
- Pearson correlation coefficient was computed to assess the linear relationship between Students’ Agreeableness and Lecturers’ Agreeableness There was a positive correlation between the two variables, r(425) = .16, p = .001.
Question 4: Regression
a. Two tailed test would be used to examines whether or not you can predict if a student wants a lecturer to be extroverted using the student's extroversion score since there is no specific hypothesis about the direction of your relationship.
b. Diagnostic
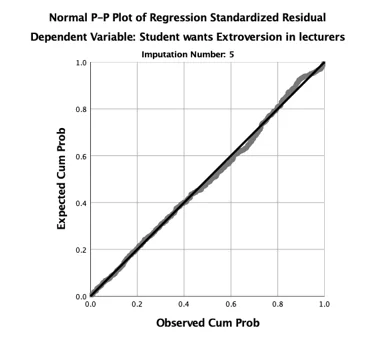
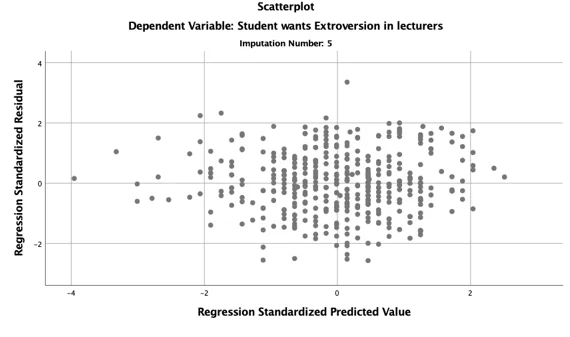
c. Assumptions
The two basic assumptions of Linear Regression analysis are the assumption of a linear relationship between the dependent variable and the independent variable(s) and the assumption of homoscedasticity. The two assumptions are met because the normal p-p plot of the residual, the data point follow the normality line and also the scatterplot does not have an obvious pattern, thus the data points are equally distributed.
d. Results
A simple linear regression was used to examines whether or not you can predict if a student wants a lecturer to be extroverted using the student's extroversion score. Students’ extroversion scores explained a significant amount in prediction ability, F (1,423) =15.843, p=.000 R^2=.036, R_(adjusted )^2=.034. The regression coefficients (B=6.86) indicated that an increase in students’ extroversion score corresponded, on average to an increase in the prediction power of whether a student wants a lecturer to be extroverted of 0.211 points.
e. No, the result of the regression analysis does not differ from the correlation results above
Question 5: Multiple Regression
a. Two tailed test would be used to examines whether or not you can predict if a student wants a lecturer to be extroverted using the student's extroversion score since there is no specific hypothesis about the direction of your relationship.
b. Diagnostic
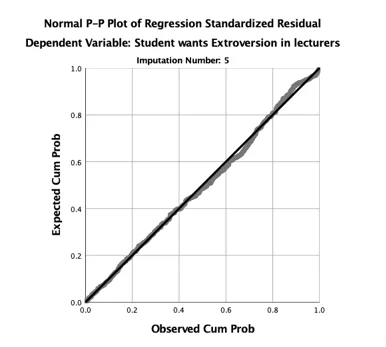
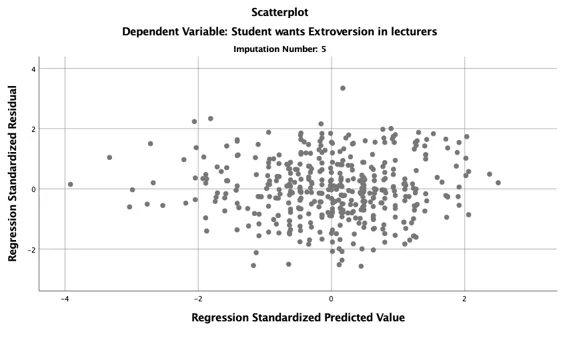
c. Assumptions
The two basic assumptions of Linear Regression analysis are the assumption of a linear relationship between the dependent variable and the independent variable(s) and the assumption of homoscedasticity. The two assumptions are met because the normal p-p plot of the residual, the data point follow the normality line and also the scatterplot does not have an obvious pattern, thus the data points are equally distributed.
d. Results
Results of the multiple linear regression indicated that there was a collective significant effect of Age, gender, and Student Extroversion in predicting whether a student wants the lecturer to be extroverted or not, (F(3, 420) = 5.276, p = .001, R^2=.036, R_(adjusted )^2=.029). The individual predictors were examined further and Students’ Extroversion (t = 3.969, p = .000) was the only significant predictor in the model.
e. No, the result of the regression analysis does not differ from the correlation results above