Diseases Control and Prevention Assignments
Several diseases are reportable, meaning that if an individual test positive for that disease then his/her physician is required by law to report that a case of that disease has developed to county health departments. Eventually, reports of these diseases are presented to the Centers for Disease Control and Prevention (CDC), where instances are monitored for outbreaks, trends, etc. In these data sets, state rates per 100,000 of certain diseases have been computed and recorded by the CDC [1, 2, 5, 3].
1. What/who are the cases? How many cases are there?
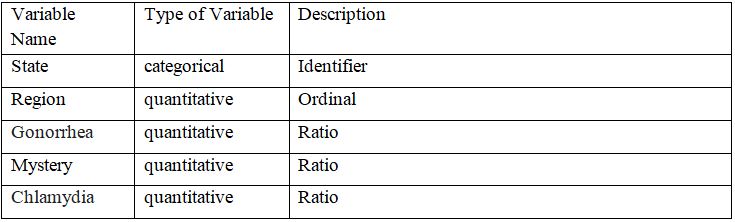
2. List the variables. For each variable, decide if it is quantitative or categorical, and describe the variable in a phrase. If categorical, make a list of possible values for that category. If the variable is actually an identifier then label that variable as an identifier - not categorical, not quantitative.
3. For each categorical variable that is not an identifier:
(a) Make both a bar chart and a frequency table using either Excel or Minitab.
(b) Write a sentence or two summarizing the frequencies and recording any notable observations you may have about the data.
4. For each quantitative variable:
(a) Make a box plot and compute the 5-number summary using Minitab.
(b) Compute the mean and standard deviation of the variable.
(c) Is the variable’s distribution symmetric, relatively symmetric, or not symmetric? Justify your answer by referring to the statistics, the box plot, and our understanding of what it means for data to be symmetrically distributed.
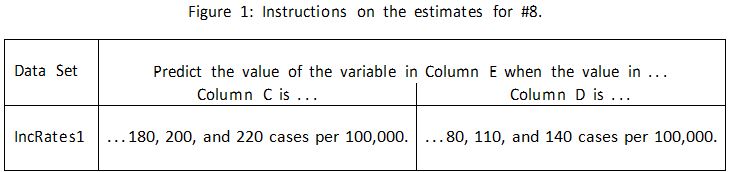
5. Make the following scatter plots. The response variable will always be the variable in Column E of the original Excel spreadsheet.
• The explanatory variable is the variable in Column C. Label this scatter plot 1A.
• The explanatory variable is the variable in Column D. Label this scatter plot 1B. For each of 1A and 1B:
(a) Describe the trends and patterns in the “cloud” of data, referring to the shape, strength, and direction of the data.
(b) This is an observational study. What potential confounding factors may exist? Remember, a confounding variable must be linked to both the explanatory and response variables. In your explanation, provide those “links”.
6. Regardless of whether or not you should, please do the following for the variables in Columns C and E.
(a) Make another scatter plot of the data and put the equation of the least-squares line (that is, the linear regression line), as well as the square of the correlation coefficient, on the graph. Remember, the variable in Column E is the response variable. Label this scatter plot 2A.
(b) Compute the square of the correlation coefficient. The square of correlation, r2, is the fraction of the variation in the values of the response variable that is explained by the least-squares regression line. Write a sentence providing an interpretation for the value of r2 that you computed. If you need an example:
Did you know that nearly 91% of the variation in manatee deaths from collisions with powerboats in a given year is explained by the number of powerboats registered that year? I plotted the linear data with manatee deaths from the collision with powerboats as the response variable and number of powerboats registered that year, and calculated r2 = 09073.
7. Repeat the last problem for the variables in Columns D and E. Label the scatter plot 2B.
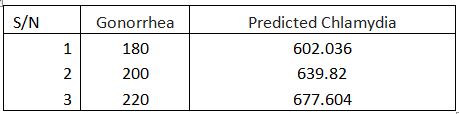
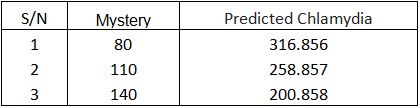
8. Use the regression lines you computed to make the estimates requested in Figure 1.
9. Two of your three rates are for STIs. Looking over all of the descriptive statistics you developed for this lab, do you think that the mystery disease is another STI? Why or why not?
Solutions:
Describing the Data #1-#4
#1. What/Who are the cases? How many cases are there?
Cases are those who tested positive for these diseases (Gonorrhea, Mystery, and Chlamydia).
We have 494,800,000 cases of Gonorrhea, 69,230,000 cases of Mystery, and 2,270,700,000 cases of Chlamydia in the state.
#2. List of variables:
#3 The Categorical Variables
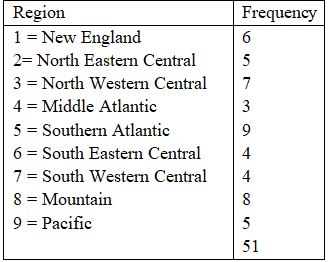
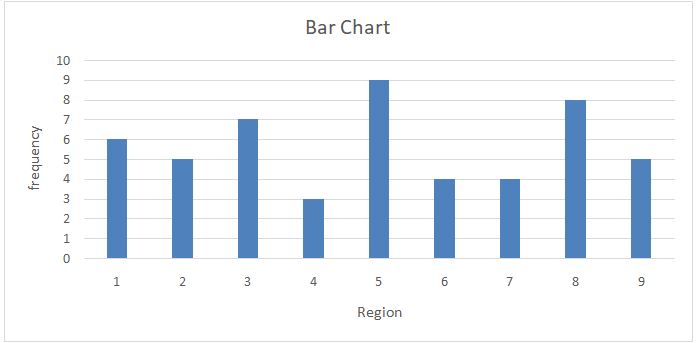
Southern Atlantic has the highest number of regions in which cases of Gonorrhea, Mystery, and Chlamydia were reported while Middle Atlantic has the highest number of regions in which cases of the diseases were reported as displayed and presented on the bar chart and frequency table respectively.
#4 The Quantitative Variables
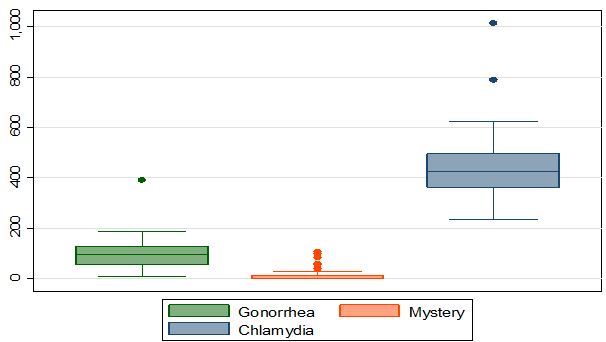
From the summary statistics and the box plot, it is clear that Gonorrhea is symmetric, Chlamydia is relatively symmetric while Mystery is not symmetric.
Analysis of Columns C and E Variables #5-#8
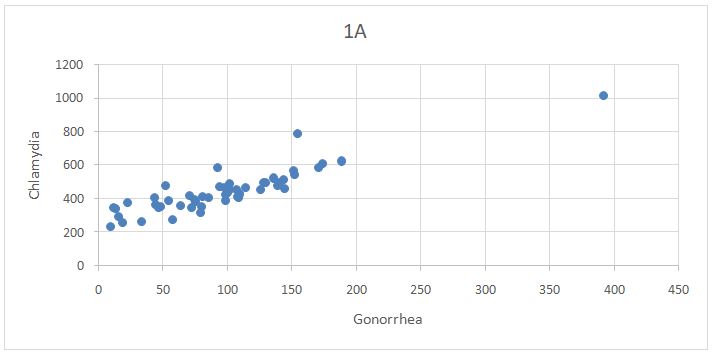
An upward trend is observed in plot 1A above. There exist a strong and positive relationship between Gonorrhea and Chlamydia.
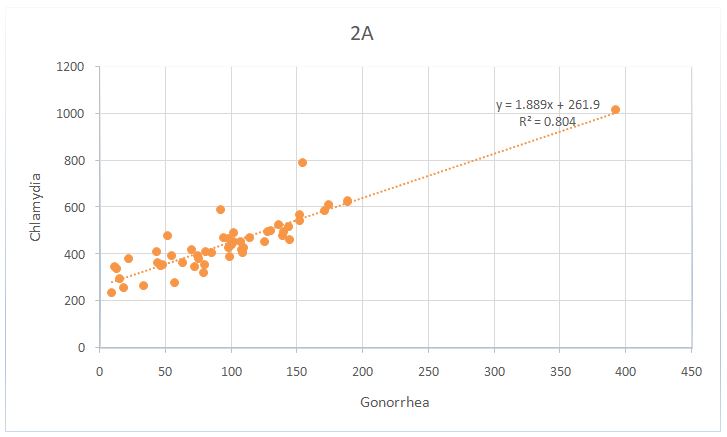
R^2=0.8048
implies that about 80.48% variation in Chlamydia is explained by Gonorrhea.
Predicted Chlamydia = 1.8892 *Gonorrhea + 261.98
Analysis of Columns D and E Variables #5-#8
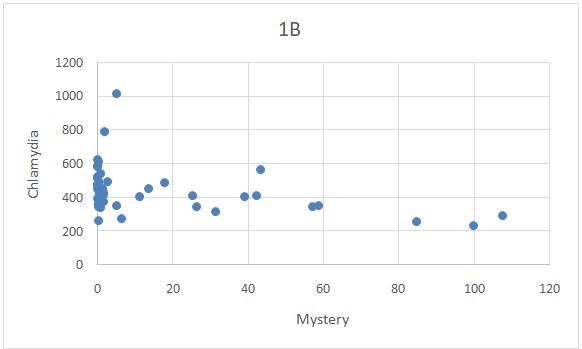
A downward trend is observed in plot 1B, there is a weak and negative relationship between Mystery and Chlamydia
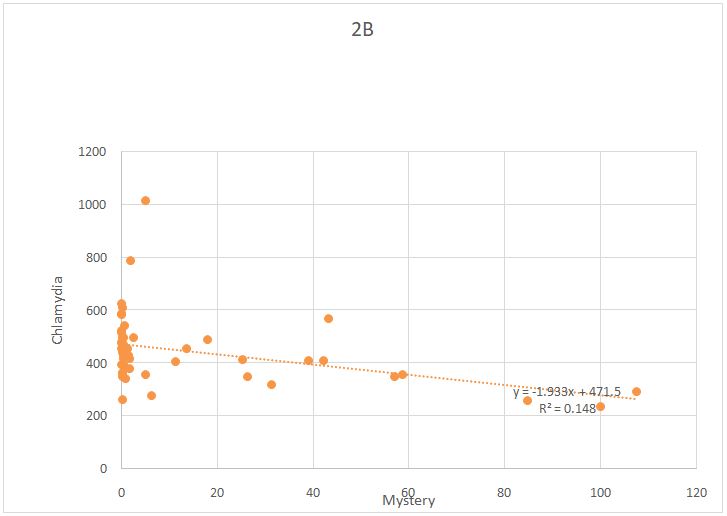
R^2=0.1487 implies that about 14.87% variation in Chlamydia is explained by Mystery.
Predicted Chlamydia = -1.9333 *Mystery + 471.52
#9. Two of your three rates are for STIs. Looking over all of the descriptive statistics you developed for this lab, do you think that the mystery disease is another STI? Why are why not?
Since there exists a weak and negative relationship between Mystery and Gonorrhea &Mysteryand Chlamydia, therefore, Mystery disease can not be regarded as another STI.