Using excel to carry our margin of error and confidence interval
Here we will use excel to carry out both the confidence interval and margin of error of Nitrate and its possibility of polluting nearby waterways.
Task
A Waikato couple has decided to improve stock management practices on their dairy farm as they are concerned about the amount of pollution that the farm has caused in nearby waterways. They are particularly concerned about the amount of nitrate run-off coming from their dairy herd. Until recently, nitrate levels in their local river were often well above the MAV (maximum acceptable value) for drinking water of 50mg/liter.
Once the final improvements on the farm were made, the farmers took frequent measurements of nitrate levels in the river over a period of 6 months. They then took a random sample of 15 of those measurements. These data are available from Blackboard in the files NitrateLevels.csv and also NitrateLevels.xlsx.
1. (a) Using Excel and the data provided, give the margin of error (to 3 d.p.) and confidence interval (to 2 d.p.) for the
i. 95% confidence interval
ii. 99% confidence interval of the nitrate levels in the river in mg/liter (to get the required accuracy you will need to give your value of s to at least 3 dp). Explain briefly what the 95% CI tells us.
2. (b) The farmers wish to test their hypothesis that the improvements they have made have caused nitrate levels in the river to drop below the MAV. Imagine that they have asked you to make use of your statistical knowledge. Using iNZight and the data provided, conduct a one-sample t-test (t-test of a mean) using a significance level of α = 0.01. Clearly show all steps in your test, including both hypotheses, the relevant information obtained from iNZight, and of course the conclusion.
3. (c) What would have been the changes to your answer to question 6b if the farmers had wanted to test whether nitrate levels were significantly different from the MAV?
4. (d) Comment briefly on the suitability of the test carried out in question 6b. You may wish to include the boxplot generated by iNZight
Here is the data set.
NitrateLevel
50.1
48
46
45.9
39.9
52.1
43.4
45.6
47.2
48.1
43.8
49.1
44.4
51.8
41.7
Solution:
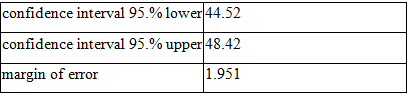
ai). Using Excel and the data provided, give the margin of error, and the 95% confidence interval is given below:
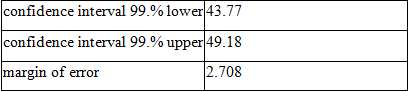
aii). Using Excel and the data provided, give the margin of error, and the 99% confidence interval is given below:
Using the dataset given, the 95% confidence interval for the mean amount is between 44.52 and 48.42.
b). The hypothesis being tested is:
Null hypothesis: H0: µ = 50
Alternative hypothesis: Ha: µ < 50
α=0.01
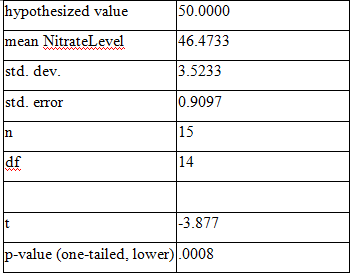
The p-value is 0.0008.
Decision: Reject the null hypothesis when p-value <0.01 (alpha level)
Conclusion: Since the p-value (0.0008) is less than the significance level (0.01), we can reject the null hypothesis.
Therefore, we can conclude that µ < 50.
c). The hypothesis being tested is:
Null hypothesis: H0: µ = 50
Alternative hypothesis:Ha: µ ≠ 50
α=0.01
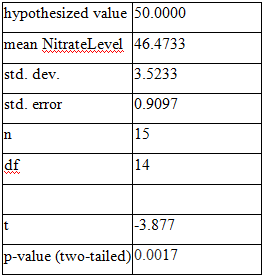
The p-value is 0.0017.
Decision: Reject the null hypothesis when p-value < 0.01 (alpha level)
Conclusion: Since the p-value (0.0017) is less than the significance level (0.01), we can reject the null hypothesis.
Therefore, we can conclude that µ < 50.
d).
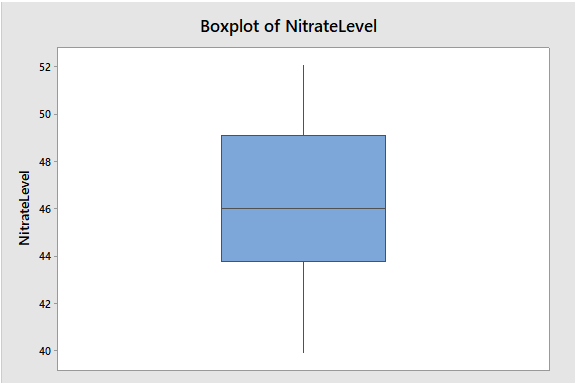
A boxplot is a graph that gives you a good indication of how the values in the data are spread out. The boxplot above on iNZight using the Nitrate Level dataset shows that the test is suitable.