Problem Description
The major aim of this statistical analysis homework is to understand the policies and practices of employers while hiring entry-level workers in the Milwaukee metropolitan area. The data was collected to gather information regarding the disposition of the employer towards applicant’s criminal record and whether it affected the applicant more unfavourably compared to other marginalized workers. Moreover, the data was collected to also understand the role which the type of crime or context of sanction played in employer’s evaluation. In addition, the data was also collected to understand the formal screens with which employers evaluate entry-level applicants and finally to understand job characteristics, company characteristics, labour market characteristics affect employer’s willingness to consider applicants with prior criminal records. A Telephone interview method was used to collect the data. The conversation was directed towards the hiring manager on questions relating to various aspect of the study. The sample constitutes 117 respondents that successfully completed the survey. The number of variables in the data set is 103.
Solution
Variables of Interest
A2B – MINORITY-OWNED COMPANY: whether the company is owned by a minority group (Binary: Yes/no)
G5 – BUSINESS HIRED CRIMINAL BACKGROUND: whether the company has hired an employee with criminal background (Binary: Yes/No)
C6C – APPLICANTS INTERVIEWED: THE proportion of applicant interviewed by the respondent (Numeric %)
C43C – RESPONDENT AGE: Age of respondents (Numeric: years)
C2A – EMPLOYEE RACIAL BACKGROUND: race of the employee (Categorical: 4 levels)
CA7 – APPLICANTS – BLACK: whether the applicant is Black (Numeric)
C7B – APPLICANTS – HISPANIC: whether the applicant is Hispanic (Numeric)
CB19 – APPLICANTS – WHITE: whether the applicant is White (Numeric)
C21_A – STARTING WAGE DOLLARS: Starting Salary (Numeric)
HYOPTHESIS
1. H0: there is no significant difference in starting wage of minority-owned business and non-minority owned business
1. H1: there is significant difference in starting wage of minority-owned business and non-minority owned business
2. H0: there is no significant difference in respondent’s age of minority-owned business and non-minority owned business
2. H1: there is significant difference in respondent’s age of minority-owned business and non-minority owned business
3. H0: there is no significant difference in proportion of Black applicants of minority-owned business and non-minority owned business
3. H1: there is significant difference in proportion of Black applicants of minority-owned business and non-minority owned business.
4. H0: there is no significant difference in proportion of Hispanic applicants of minority-owned business and non-minority owned business
4. H1: there is significant difference in proportion of Hispanic applicants of minority-owned business and non-minority owned business.
5. H0: there is no significant difference in proportion of White applicants of minority-owned business and non-minority owned business
5. H1: there is significant difference in proportion of White applicants of minority-owned business and non-minority owned business.
6. H0: there is no significant difference in starting wage across employee’s racial background
6. H1: there is significant difference in starting wage of across employee’s racial background
7. H0: there is no significant difference in respondent’s age across employee’s racial background
7. H1: there is significant difference in respondent’s age across employee’s racial background
8. H0: there is no significant association between whether business hired person with criminal background or not and whether the business is minority-owned or not
8. H1: there is significant association between whether business hired person with criminal background or not and whether the business is minority-owned or not
9. H0: there is no significant association between whether business hired person with criminal background or not and Employees racial background
9. H1: there is significant association between whether business hired person with criminal background or not and and Employees racial background
10. H0: there is no significant association between whether business is minority owned or not and Employees racial background
10. H1: there is significant association between whether business is minority owned or not or not and Employees racial background
APPROPRIATE TEST
H1-H6 = Independent Samples t-test because dependent variable is continuous and independent variable is categorical with only two levels
H7-H8= one-way ANOVA because dependent variable is continuous and independent variable is categorical with more than two levels
H9-H11 -= chi-square because both dependent variable and independent variable are categorical
DESRIPTIVE STATISTICS
Table 1: Summary statistics
| Toughest FEA Topics | How We Excel |
|---|---|
| Nonlinear Analysis | Our experts are proficient in solving complex nonlinear FEA problems, including material nonlinearity, geometric nonlinearity, and contact analysis, ensuring accurate and comprehensive solutions. |
| Dynamic Analysis | We have the expertise to handle dynamic FEA assignments, offering solutions for problems involving modal analysis, transient analysis, and frequency response analysis, providing in-depth insights into structural behavior. |
| Optimization | Our website is equipped to tackle optimization problems in FEA, including topology optimization, shape optimization, and parametric optimization, ensuring that structures are designed efficiently and cost-effectively. |
| Multiphysics Analysis | We specialize in addressing multiphysics FEA assignments, which involve the coupling of multiple physical phenomena, such as structural mechanics, heat transfer, and fluid flow, ensuring a holistic understanding and accurate results. |
| Advanced Meshing Techniques | We excel in mesh generation for complex geometries, utilizing advanced meshing techniques such as adaptive mesh refinement and hybrid meshing to provide accurate solutions for intricate FEA models. |
| High-Performance Computing | Our team leverages high-performance computing and parallel processing to handle computationally intensive FEA simulations efficiently, delivering faster results and solving large-scale FEA problems effectively. |
| Advanced Post-Processing | We go beyond basic results visualization by offering advanced post-processing techniques, including stress analysis, deformation analysis, and mode shapes, providing comprehensive insights into FEA outcomes. |
Note: N represents number of non-missing observations for each variables
| MINORITY-OWNED COMPANY | Freq. | Percent |
|---|---|---|
| Yes | 14 | 8.38 |
| No | 153 | 91.62 |
| Total | 167 | 100 |
BUSINESS HIRED CRIMINAL BACKGROUND
| Yes | 75 | 47.47 |
|---|---|---|
| No | 83 | 52.53 |
| Total | 158 | 100 |
EMPLOYEE RACIAL BACKGROUND
| White | 94 | 60.26 |
|---|---|---|
| Black | 36 | 23.08 |
| Hispanic | 16 | 10.26 |
| Others | 10 | 6.41 |
| Total | 156 | 100 |
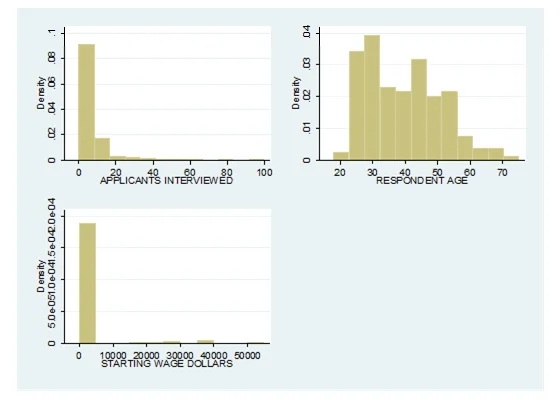
Fig 1: Histogram
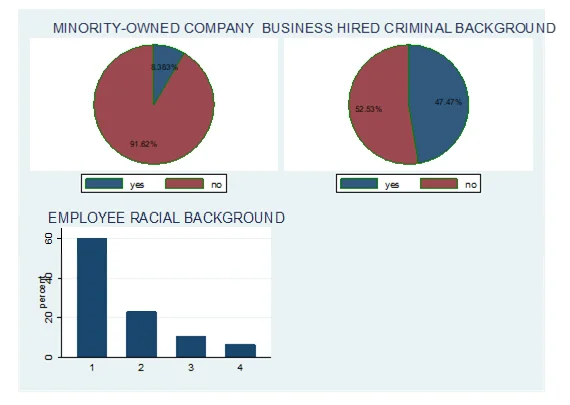
Fig 2: Pie and Bar Chart
Report
Table 1 presents the summary statistics of the continuous variables in the model. The result showed that average value of applicants interviewed is 8.19 while the variation around the mean measured by standard deviation is 12.65. The number of valid observation is 164. The lowest value of applicant’s interview is 0 and the highest is 100. Average value of respondents’ age viewed is 39.37 while the variation around the mean measured by standard deviation is 11.59. The number of valid observation is 166. The lowest value of respondents’ age is 18 and the highest is 75. In addition, average value of proportion of black applicant is 26.43 while the variation around the mean measured by standard deviation is 23.61. The number of valid observation is 150. The lowest value of number of black applicant is 0 and the highest is 100. Average value of proportion of Hispanic applicant is 26.43 while the variation around the mean measured by standard deviation is 23.61. The number of valid observation is 149. The lowest value of prooportion of Hispanic applicant is 0 and the highest is 100. Average value of proportion of White applicant is 56.25 while the variation around the mean measured by standard deviation is 28.14. The number of valid observation is 149. The lowest value of proportion of White applicant is 0 and the highest is 100.
Table 2 presents the frequency distribution of the categorical variables. The result showed that 60.26% of the respondents are white, 23.08% are black, 10.26% are Hispanic while 6.41% belong to other race. 8.38% of the organization sampled are minority owned while 91.62% are not. Finally, 47.7% of the firms sampled hired workers with criminal background while 52.53%. The same information is presented graphically in fig 2. Fig 1 presents histogram for applicant’s interviewed, respondents age and starting wage in dollar. The plot showed that none of the variables is symmetric,