Problem Description:
The STATA homework focuses on understanding the economic reasons behind the regulation of public utilities, particularly in the context of monopolistic industries. It explores the role of government in safeguarding customers against exploitation, emphasizing pricing regulation, quantity control, budgetary oversight, and infrastructure development. The homework also delves into electricity market regulation in the United States, highlighting deregulated and regulated states, with a special focus on Texas. Additionally, it investigates pricing deviations in the electricity industry and presents a comparative analysis of distribution patterns between residential and commercial consumers.
Question 1
Economic reason behind the regulation of public utilities
Most products are found from private sectors. The private sectors can either be monopolistic or perfectly competitive depending on the number of firms in the industry. The monopolistic sectors are the price setters and most of them are regulated by the state to avoid customer manipulation.
The public utilities have monopoly over the services when the ownership is individual. This is where the government comes in with the regulations that heavily protect the customer against exploitation. The government does this by regulating the price of the product and the quantity supplied to the market. They also regulate the budgetary process and the ability to construct new facilities. According to Harold Demsetz (2016), if a product is produced under cost conditions such that larger rates this would mean lower average cost per unit and vice versa.
The standardized pricing rule that regulates the price, price ceiling is known as the average cost pricing. The public utilities will need to set a price that is close to the average cost needed to produce it. This rule is applied to the monopolistic legal businesses that are regulated by the public utility
Question 2
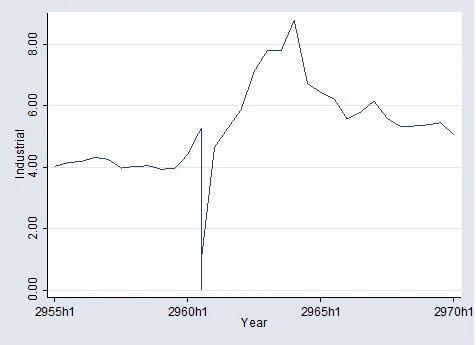
Across the U.S., electricity markets are currently regulated in Alabama, Alaska, Arizona, Arkansas, Carolina, Florida, Hawaii, Idaho, Indiana, Lowa, Kansas, Kentucky, Louisiana, Minnesota, Mississippi, Missouri, Montana, Nebraska, Nevada, New Mexico, New Carolina, North Dakota, Oklahoma, South Carolina, South Dakota, Tennessee, Utah, Vermont, Washington, West Virginia, Wisconsin and Wyoming and deregulated in Connecticut, Delaware, Maine, Massachusetts, New Hampshire, and Texas. Residents who live in the service territory of the following utilities or electric co-ops can switch to an alternate electricity supplier. Texas represented the deregulated countries giving the graph shown below.
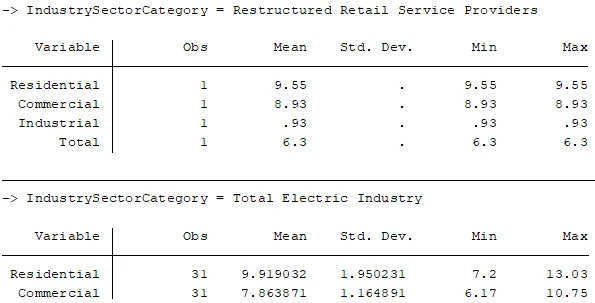
Question 3
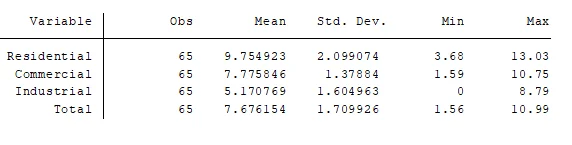
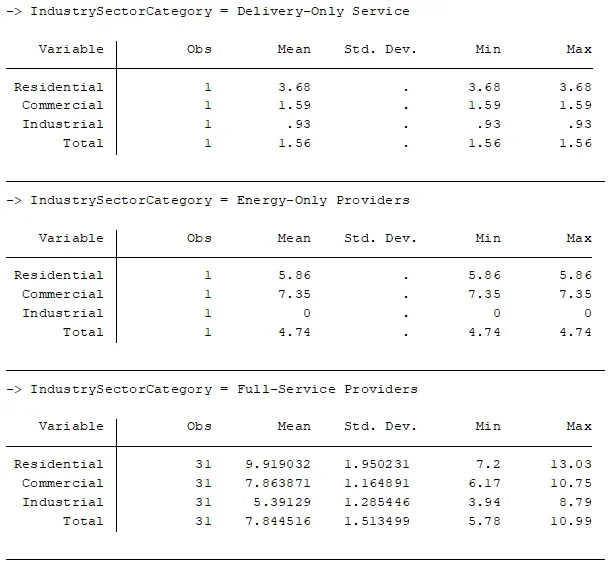
The pricing of electricity across the industries has minimal deviations from the mean in Texas. This is in reference to the table above indicating that the residential had the highest average of 9.754923 and Industrial had 5.170769. looking at the industry type, the deviation between total electric industry and delivery only is quite large. This means that there is a price discrimination. The distribution of how price is set by different firms is shown by the tables below.
Question 4
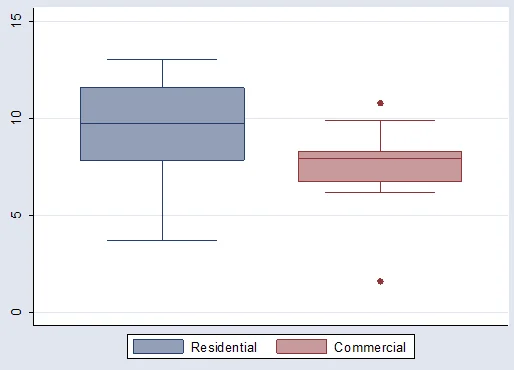
There is a wider distribution between the residential consumers in Texas as compared to the commercial consumers in the same state. The commercial consumers had the lower median as compared to the residential consumers. The difference can be shown by using a boxplot shown in the figure below.