The probability of a candidate winning
Here we use descriptive statistics to determine the probability of one candidate winning the school election as opposed to the other.
Question 1
The latest NYC Democratic Mayoralty Primary Poll1 (released on 06/14) of 876 primary voters and a margin of error of +/- 3.8 percentage points shows that “Eric Adams (24%) leads the field of candidates among New York City likely Democratic primary voters [...]. Kathryn Garcia (17%), Maya Wiley (15%), and Andrew Yang (13%) follow.” My neighbor just told me: “Too bad Adams will win, but I'm excited that Garcia will be second. She is the best!”
a. What should I tell my neighbor? Why?
Solution
I will tell my neighbor that the margin of error is not too wide to guarantee that Eric Adams will be the winner eventually.
Question 2
For the following “hypothetical” statements, build the null and alternative hypotheses.
a. Millennials use social media all the time; I suspect they use them at least 5 hours a day in my office.
b. Hispanic people are more likely to drive above the speed limit than African Americans.
c. People that eat junk food don’t live past 85.
d. It is impossible to find an entry-level position that pays less than 25,000 a year.
e. There is no wage gap between men and women.
Solution
a. Null hypothesis: Millennials use at least 5 hours a day in my office
Alternative Hypothesis: Millennials useless 5 hours a day in my office
b. Null hypothesis: Hispanic people are more likely to drive above the speed limit than African
Americans
Alternative Hypothesis: Hispanic people are less likely to drive above the speed limit than African Americans
c. Null Hypothesis: People that eat junk food don’t live past 85
Alternative Hypothesis: People that eat junk food live past 85
d. Null Hypothesis: It is impossible to find an entry-level position that pays less than 25,000 a year
Alternative Hypothesis: It is not impossible to find an entry-level position that pays less than 25,000 a year
e. Null Hypothesis: There is no wage gap between men and women.
Alternative Hypothesis: There is a significant wage gap between men and women.
Question 3
Discuss the implications of the following situation: Suppose you are designing a new state-wide safety net policy for families that fell into poverty due to the COVID-19 pandemic. Your team collected a large and representative sample that concluded, with statistical significance, that families with two or more children earned $50 less than one-child families (yearly). Someone in your team recommended that you exclude one-child families from the new policy because of the results.
Solution
One of the implications of excluding one-child families from the new policy because of the results is biasedness because the original size of the sample has been reduced and this could result in an improper interpretation of the analysis due to loss of information.
Question 4
The average processing time of an immigration application case is 390 days, with a standard deviation of 205 days. Assuming there is a normal distribution, calculate [Excel: NORMSDIST(_)]:
1. The probability that a case is processed within a year (365 days).
2. The probability that a case is processed after two years.
3. The probability that an applicant receives a decision in between one and two years.
Solution
a. The probability that a case is processed within a year (365 days) = 0.4515
b. The probability that a case is processed after two years = 0.1325
c. The probability that an applicant receives a decision in between one and two years = 0.867522-0.4515 = 0.4161
Question 5
Differences between groups: Use the dataset "Patient Survival in Drug Trial" [command: sysusecancer.dta].
a) Do you agree with the following statement? (Show your process) "If we look at survival rates in the trial, age is such an important factor to consider."
a. Remember to check the following assumptions: normality (visually and conducting a test), equal variance.
b) Because it is a new drug they are testing, the principal investigator wants to know if results hold at a 99% confidence level. Do the results hold?
Conducting a test for normality and equal variance
Here we will use descriptive statistics to determine patient survival in the drug trials. We want to evaluate the level of confidence in the drug.
Solution
Test for Normality
Graph
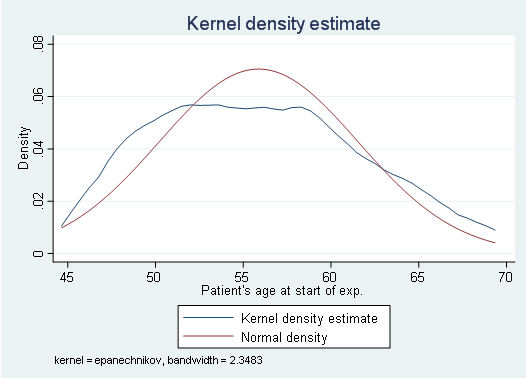
The dumbbell shape of the plot above shows evidence of the normality of the dataset
Test
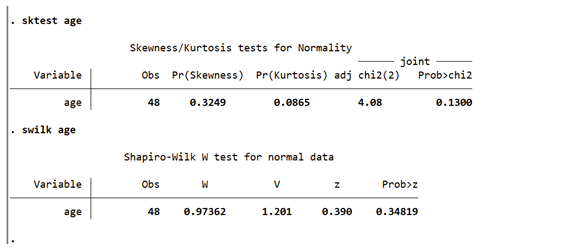
Both the Shapiro Wilk test and the skewness test for normality support the claim of the kernel density plot of normality.
Test for equal variance.
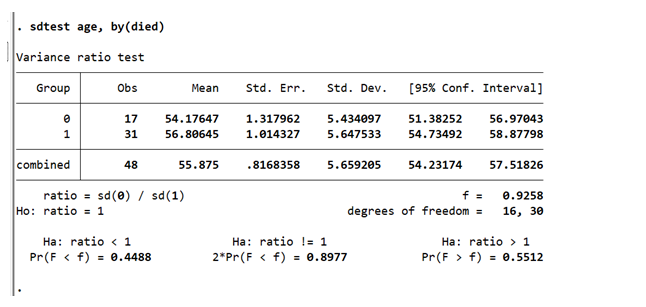
From the variance ratio test table, we can see that the assumption of homoscedasticity is not violated.
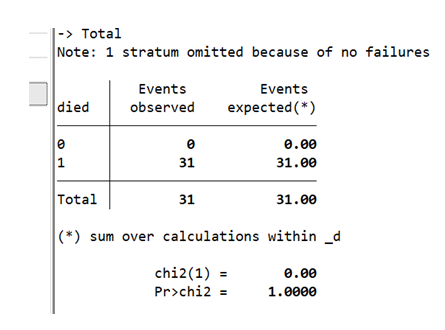
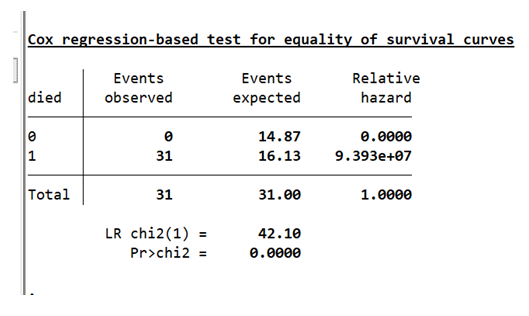
Cox Proportional Hazard Model
We performed the log-rank test for equality of survival
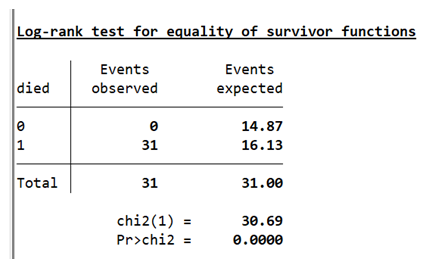
The p-value suggests that the survivor function are not all the same. p-value suggests that the survivor function are not all the same.
We then performed the Cox
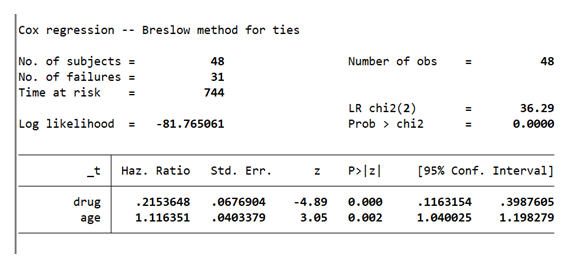
From the Cox regression analysis table above, we could see that the variable age has a great significant impact on the model at a 0.05 level of significance.
2. Testing at 99% confidence level
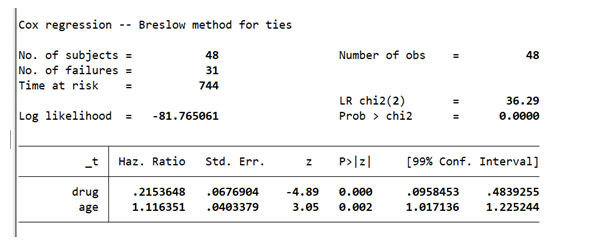
The variable age has a significant impact on the model at a 99% confidence level.
Question 6
Differences between groups: Use the dataset “NSLW 88” [command: sysuse nlsw88.dta]
a. Respond: Are unionized workers older than non-unionized?
ii. Remember to check the following assumptions: normality (visually and conducting a test), equal variance.
Solution
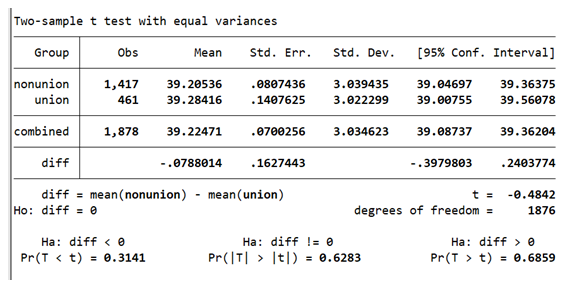
Test for normality
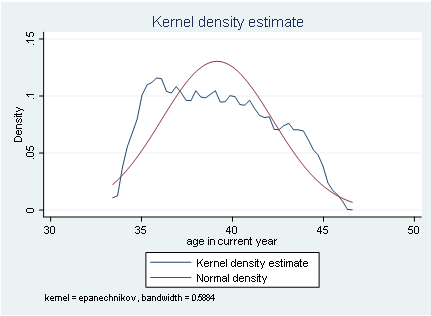
The kernel density plot suggests evidence of normality of the data.
Test for equal variance
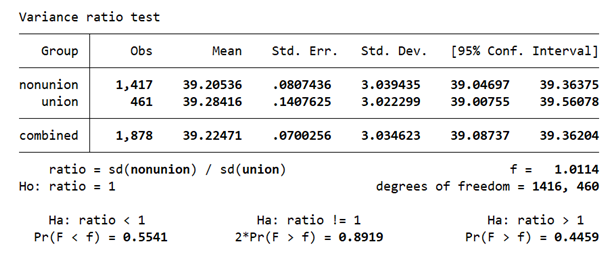
From the variance ratio test table, we can see that the assumption of homoscedasticity is not violated.