Using OLS to carry out demand model
Here, we have used the OLS to carry out the demand model to interpret the rate of demand for chicken. We will also check the possible substitutes such as beef.
Task 1
Answer the following questions based on the following situation.
Jacob constructed the following model to find the demand for chicken in the United States. All units are referenced on a per-pound basis. Afterward, the OLS results of the coefficients are reported.
〖lnChicken〗_i=β_0+β_1 〖lnChickenPrice〗_i+β_2 〖lnBeefPrice〗_i+e_i
β_0=1.19 (P-Val: 0.043)
β_1= .5 (P-Val: 0.002)
β_2= .3 (P-Val: 0.034)
Based on the model and Jacob’s results, what would be the expected change in Chicken consumption if there was a 2 percent increase in the price of beef? Be sure to show your work.
Solution
β_2= .3
The expected change in Chicken consumption is by 〖2*β〗_2 percent
2*β_2=0.6
Hence, a 2 percent increase in the price of beef will lead to a 0.6 percent increase in Chicken consumption.
2. Based on the model and Jacob’s results, would beef be a substitute or a complimentary good with chicken? Why?
Solution
Beef is a substitute good with chicken.
Reason: when the price of beef rises, the quantity of chicken demanded also rises as evident in the coefficient of beef stated above which is positive and statistically significant.
Are there any concerns with Jacob’s model or the results?
Solution
Overall Model performance was not reported, also, the coefficient of Beef price β_2 is slightly significant at 5% but insignificant at 1% level of significance.
Task 2: Classroom Disciplinary Issues
James constructs the following model for the rate of disciplinary actions across classrooms based on the following model. The data for all variables is at the classroom level. 〖Discipline〗_iis the average number of disciplinary actions per student in a classroom throughout the year (such as detention, ISS, etc.). 〖Income〗_iis the average income for students in the classroom and 〖PercentGamers〗_i is the percent of students in a classroom that play at least 10 hours of videogames each week.
〖Discipline〗_i=β_0+β_1 〖Income〗_i+β_2 〖PercentGamers〗_i+e
With β_2 being positive and significant, James concludes that video games cause students that play them to become disruptive in class. Is this a conclusion that James can make? Why or why not?
Solution
No, this is not the conclusion that James can make
Reason: β_2 being positive and significant implies that asPercentGamers increases, Discipline also increases, however, the coefficient of income wasn’t mentioned and the variable is missing in his conclusion.
1a. If this is not a conclusion James can make, provide an alternate explanation for why this trend appears.
Solution
The effect of income in the model is being neglected as this can greatly impact the dependent Variable (Discipline).
Task 3: Payoffs
There are three investment options available. The payoffs for different investments are listed below. Make sure your answers are complete and go beyond the most surface level of the answer.
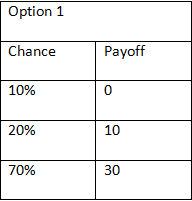
Mean payoff = 23, Variance = 301
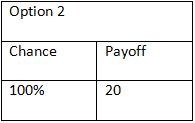
Mean payoff = 20, Variance = 0
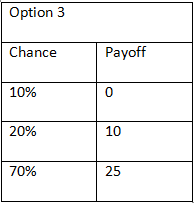
Mean payoff = 19.5, Variance = 257.25
1. Would a bank or an individual investor be more likely to choose option 1 over option 2? Make sure to include an explanation of why. Which one might be more likely to select option 2?
Solution
A bank or an individual investor is NOT more likely to choose option 1 over option 2 because the mean payoff of option 2 is lower than that of option 1. Also, the Variance of option 2 is zero indicating no risk compared to option 1
2. Would a bank be more likely to choose Option 3 or Option 2?
Solution
The bank is more likely to choose option 2 even though the mean payoff of option 3 happens to be the smallest among the three options. It Variance makes it riskier than option 2.
Task 4: Portfolio Beta
The set of the information below is John Doe’s portfolio of stocks. John Doe has no investments outside of this portfolio.
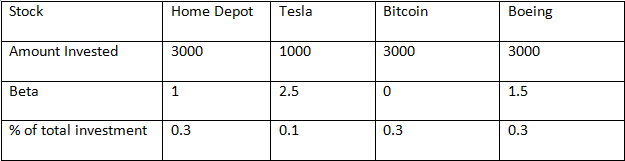
1. What is John Doe’s Portfolio Beta? _____________
Solution
Portfolio Beta=(0.3*1)+(0.1*2.5)+(0.3*0)+(0.3*1.5)
Portfolio Beta=1
2. Would removing all of bitcoin from John Doe’s portfolio make the portfolio follow the Market better or worse? Y or N (Circle One)
Solution
No, the portfolio will follow the market worse.
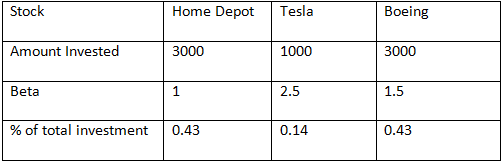
a. How do you know?
Portfolio Beta=(0.43*1)+(0.14*2.5)+(0.3*1.5)
Portfolio Beta=1.23
Since the portfolio beta is greater than 1, the portfolio has a higher systematic risk than the market.
Task5: Ice Cream Sales
The following question assumes that we have been hired by the Very Cold Ice cream shack to predict sales. The following function represents the regression model you used.
Sales= β_0+β_1 Price+β_2 Summer+β_3 (Price*Summer)+u
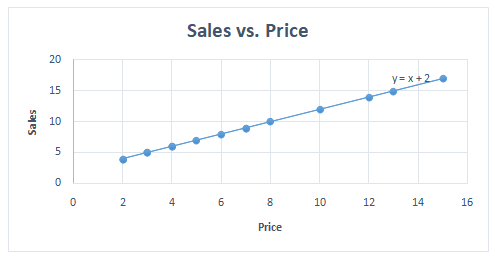
You run OLS and find the following coefficients for the above model. β_0=2,β_1=1,β_2=3,β_3=2. Graph the results for Sales vs Price with a line for Summer and another one for Not Summer.
Solution
Summer: Sales= 2+Price+3*Summer+2*(Price*Summer)
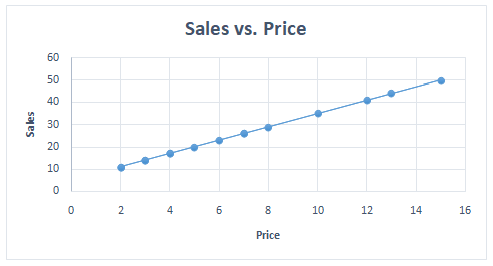
Not summer: Sales= 2+Price