Constructing Decision Tables and Calculating Variables from Them
Our proficient statisticians have constructed various well-labeled decision tables according to the questions and answered several questions from them. The solutions include calculating sensitivity, specificity, and positive rates among other parameters. All answers are correct.
Constructing a Decision Table
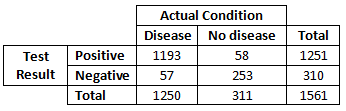
1. A blood test was performed on several patients. Given the following data
Total patients = 1,561
Patients who tested positive and had the disease = 1,193
Patients who tested negative and did not have the disease = 253
Patients with positive test results without the disease = 58
Patients with a negative result but with the disease = 57
a. Construct a well-labeled and properly filled 2 x 2 decision table for the given data
Calculating the Sensitivity, Specificity, and the False Positive Rate
b. Calculate the sensitivity of the test
Sensitivity = (True Positive)/(True Positive + False Negative) = 1193/(1193+57) = 1193/1250
Sensitivity = 0.954
c. Calculate the specificity of the test
Specificity = True Negative/(True Negative + False Positive) = 253/(253+58) = 253/311 = 0.8135 ~ 0.814
d. Calculate the false positive rate
False positive rate = False Positives/(True Negatives) = (58)/(58+253) = 58/311 = 0.186
e. Calculate the false-negative rate.
False negative rate = False negatives/(True positives) = 57/(57 + 1193) = 57/1250 = 0.046
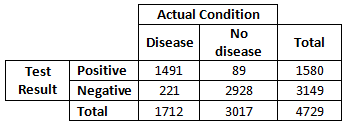
2. A blood test was performed on several patients. Here is the data obtained from the test.
Patients with a positive test result and have the disease = 1,491
Patients with a negative test result = 3,149
Patients who tested positive but do not have the disease = 89
Patients without the disease = 3,017
a. Come up with a 2 x 2 decision table for the data given above
b. Calculate the sensitivity of the test
Sensitivity = (True Positive)/(True Positive + False Negative) = (1491)/(1491 + 221) = 1491/1712 = 0.871
c. Calculate the specificity of the test
Specificity = True Negative/(True Negative + False Positive) = 2928/(2928+89) = 2928/3017
Specificity = 0.9705 ~ 0.970
d. Calculate the false positive rate
False positive rate = False Positives/(True Negatives) = (89)/(89 + 2928) = 89/3017 = 0.029
e. Calculate the false-negative rate.
False negative rate = False negatives/(True positives) = 221/(221 + 1491) = 221/1712 = 0.129
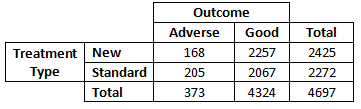
3. Two groups of patients were selected for a study that seeks to compare a new and standard treatment. One group of patients received the new treatment and one group received the standard treatment. Some patients in each group had an adverse outcome and some patients in each group had a good outcome. Given the following data:
Total patients = 4,697
Patients who had an adverse outcome with the new treatment = 168
Patients with bad/adverse outcomes with the standard treatment = 205
Patients with a good outcome (new treatment) = 2,257
Patients with a good outcome (standard treatment) = 2,067
a. Construct, label, and completely fill in a 2 x 2 decision table that accurately reflects the data
b. Calculate the relative risk of an adverse outcome for the new treatment
Relative risk (RR) of an adverse outcome for new treatment = 168/(168+2257)/(205/(205+2067)) = 0.768
c. Calculate the relative risk reduction for the new treatment
Relative risk reduction = [(205/(205+2067)) - 168/(168+2257)]/ [(205/(205+2067))] = 0.232
d. Calculate the risk difference
Risk difference = [(205/(205+2067)) - 168/(168+2257)] = 0.021
e. Calculate the number needed to treat for the new treatment
Number needed = 1/[(205/(205+2067)) - 168/(168+2257)] = 47.7315 ~ 47.732
4. A restaurant in your town had 163 diners on Friday night. By Monday evening, 24 of those diners had reported to the Emergency Department, outpatient clinics, or saw their physicians with symptoms of gastrointestinal distress, suggesting food poisoning. Stool cultures for Salmonella were positive in all 24 diners.
a. What is the estimated* probability of a diner having contracted food poisoning at that restaurant on that Friday night?
[*Note: This is an estimated probability because it doesn’t include persons whose symptoms may not have been severe enough for them to have sought medical attention (the actual probability could be higher); nor does it exclude the possibility that some of those symptomatic people may have contracted food poisoning from some other source (the actual probability could be lower); but the estimated probability would give epidemiologists a baseline figure to work from.]
5. In 2017, Texas led the nation in the percentage of people who lacked health insurance (17% of the population) [Ref: https://www.texmed.org/Template.aspx?id=42282]. It is known that, nationally, 5% of patients account for 50% of the costs of healthcare. These are the “high cost” patients.
Assume* that:
Being a high-cost patient and being uninsured are independent characteristics
Insured and uninsured people become “patients” at the same rate
The uninsured and high-cost patients in Texas are evenly distributed across the state, and those high-cost patients are evenly distributed across insured and uninsured patient populations
a. What is the probability that a patient in a Texas healthcare facility will be a high-cost patient who is uninsured?
[These are huge and unrealistic assumptions, but let’s assume them just for the purpose of this problem].