Data tables and figures based on different data and the explanations
The following are tables and figures of different types developed according to various types of data. Each table/figure is accompanied by a piece of explanation on why it has been designed that way. For example, some tables are designed in their format because of the nature of the data used like frequency distribution and summary statistics, and so on.
Question
1. A study was conducted to evaluate knowledge about and attitude toward hand hygiene practices of nursing professionals.
Sample size: 131 nurses (55 hospital A, 76 hospital B)
Instruments: Knowledge score range: 0 – 80; Attitude score range 0 to 44
Hospital A
Knowledge score: Min. 36, Max. 74, Average 61.91, Standard Deviation 7.01, 95% CI 60.70-63.12
Attitude score: Min. 30, Max.44, Av.38.72, SD 2.71, 95% CI 38.25-39.19
Hospital B
Knowledge score: Min. 36, Max. 74, Average 61.13, SD, 7.34, 95% CI 61.24-64.72
Attitude score: Min. 32.00, Max. 44, Average 38.79, SD 2.53, 95% CI 38.21-39.37
Descriptive Statistics of Knowledge and Attitude as a Function of Hospital
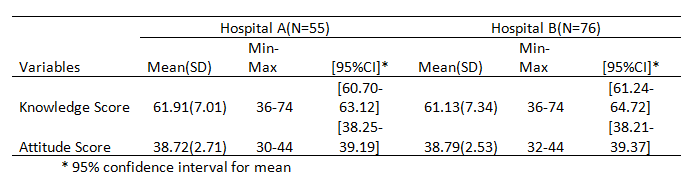
The format in Table 1 was used because the result is a summary of statistics by group. The group is a hospital that is categorical with two levels and was placed on the horizontal axis. Knowledge and attitude are the dependent variable and are placed on the vertical axis. The result for mean, SD, min, max, and CI was fixed inside the columns.
2. A survey was conducted to evaluate employee flu vaccination rates in medical centers during the 2016-2017 flu season.
| Number of centers | % of employees vaccinated |
| 2 | 0-9% |
| 4 | 10-19% |
| 6 | 20-29% |
| 16 | 30-39% |
| 25 | 40-49% |
| 30 | 50-59% |
| 27 | 60-69% |
| 15 | 70-79% |
| 8 | 80-89% |
| 1 | >90% |
Frequency Distribution of Flu vaccination rates among Employees of Medical Centre
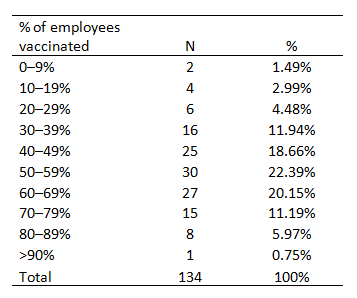
The format in table 2 was used because the result is the frequency distribution of vaccination rate among employees. Percent of employees vaccinated is the variable of analysis.
3. A controlled clinical study was conducted to examine the effect of 2% lidocaine application prior to surgical site closure by CDC Surgical Site classification.
Lidocaine group: 45 patients (average age 51.46, SD 21.5)
Saline (control) group: 39 patients (average age 46.9 , SD 18.6)
Total # of infections: Lidocaine 4, Saline 11 (p = 0.02)
Grade I: Lidocaine 0 infections, Saline 0 infections
Grade II: Lidocaine 2 infections, Saline 2 infections
Grade III: Lidocaine 0 infections, Saline 3 infections
Grade IV: Lidocaine 2 infections, Saline 6 infections
Summary Statistics by Experimental and Control Group
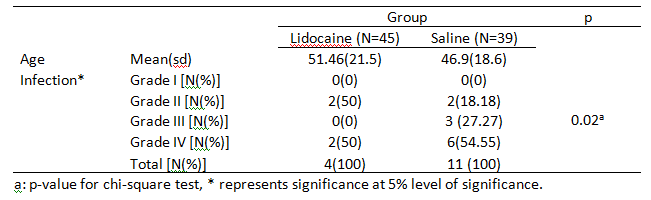
The format in Table 3 is appropriate because the data provided is summary statistics and frequency by the experimental and control groups. Since a test of significance was conducted, the column for chi-square’s p-value was included
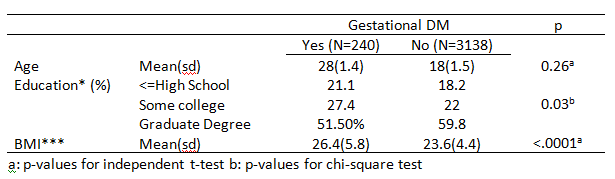
4. A study was conducted to examine the effect of body mass index on gestational diabetes mellitus.
Women who developed gestational DM: 240; Average age 28 (SD 1.4); Education Women who did not develop gestational DM: 3138; Average age 18 (SD 1.5), Education < high school 18.2%, some college 22%, graduate degree 59.8%; BMI mean 23.6 (SD 4.4).
P values from t-test or Chi-square test: age 0.26, education 0.03, BMI < 0.0001
Summary Statistics of Age, Education, and BMI by Gestational DM status *, ***represents significant at 5% and 1% level of significance respectively
The format above was used because we are displaying summary statistics and tests of significance for various variables.