Diabetes in 130-US hospitals for years 1999-2008 data set.
We are going to use data to evaluate 120 hospitals in the US regarding diabetes. The information is based on the rate of admission and readmission.
Introduction
Diabetes is a disease which is been detected in people across the globe. It has been observed that there is a direct impact on morbidity and mortality of hospitalized patients if hyperglycemia is not managed well. This becomes more vital if the patient is admitted to a crucial condition in ICU. Additionally, most of the expenditure of the patient goes in readmission and this becomes more active in case of the diabetic patients. Hence to reduce readmission plays a key role in bringing the expenditure of medical down. In this study, we have identified the chances of diabetic patients getting readmitted by analyzing ~50 features and using advanced classifiers of machine learning. The outcome and model will help in identifying the key reasons (out of the 50 features) behind the readmission of diabetic patients. The database provided here was difficult to analyze as there were a lot of missing values and most of the time data found were inconsistent.
Method
To analyze the data, we first identified the NA values in our data set. There were different types of missing data representation present in the database. We identified there were 2 types of missing value identifiers which were “?” and “Unknown/Invalid”. We then identified the columns which were had the majority of the data missing. The column name“weight”, “Payer code” and “Medical specialty” were having the majority of the data missing and hence they were dropped from the analysis. Removing such columns is necessary as they will not help in any fruitful prediction and will act as noisy data. “Citoglipton” and “Examine” columns were also removed as they were having similar values in the record. Additionally, we also removed the data of the patients who eventually died as they will not be readmitted to the hospital. To make the analysis more robust we collapsed the ICD-codes to only 9 diseases as shown in the image below.
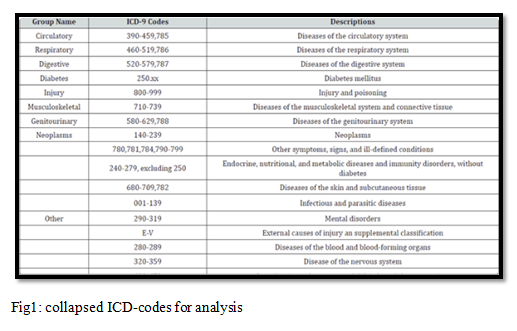
In a similar fashion, we regrouped the age parameter too. Moving further we only kept 7 medication features and the rest were removed. We also marked the patient as readmitted if the patient was readmitted within 30 days and zero if there was no readmission or admission after 30 days. We also removed the outliers from the data using a boxplot.
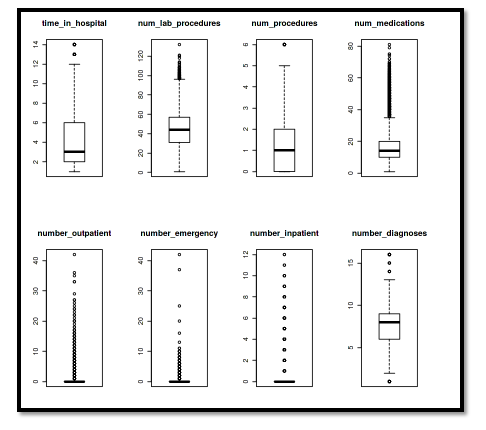
Fig2: Identification of an outlier in the data
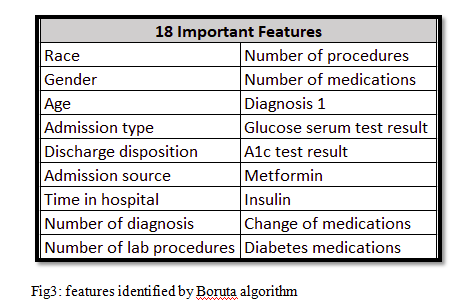
We also looked for multicollinearity in the data, but it was not identified. Hence, we moved forward with data after applying all the filters and collapsed strategy which gave us 24 features. Identify the features we applied boruta algorithm. Boruta algorithm identified 18 attributes that were important.
Moving further we used three classifiers method which includes decision tree, random forest, and logistic regression. Before moving further, we decided to balance the data using ROSE. Cross-validation was done using the k-fold cross-validation method. We randomly distributed the data into test and training data.
Models
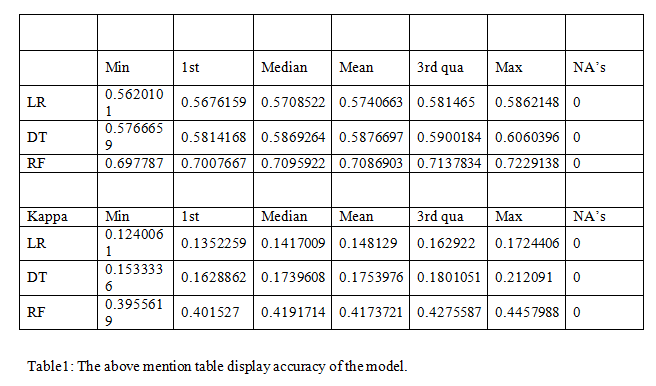
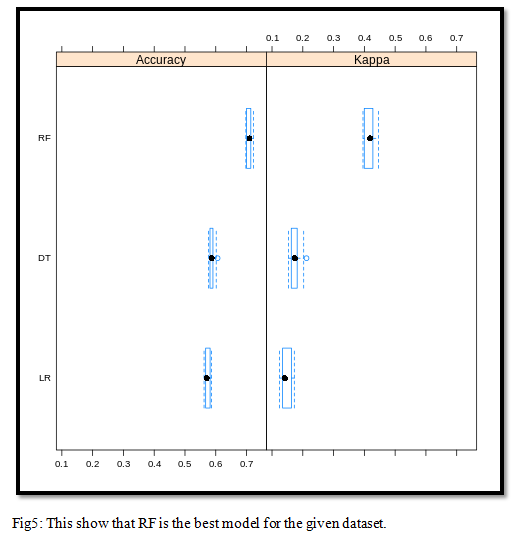
We worked with three models and used k-fold cross-validation for the dataset as it will enhance the model accuracy. In our analysis, we identified that the random forest is the best performing model with the given data as can be seen in the table below.
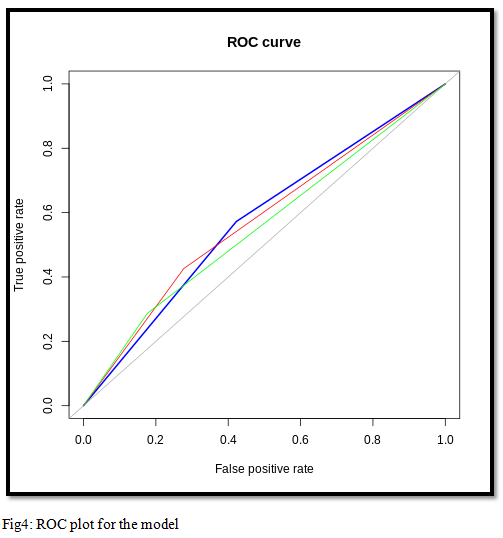
The ROC plot for the models is shown below
We also plotted accuracy and kappa plot so that we can conclude which model was performing the best.
We identified which are the most important variable for the readmission from the model as shown below and we observed that discharge disposition and time in hospital variables are directly associated with readmission of patients
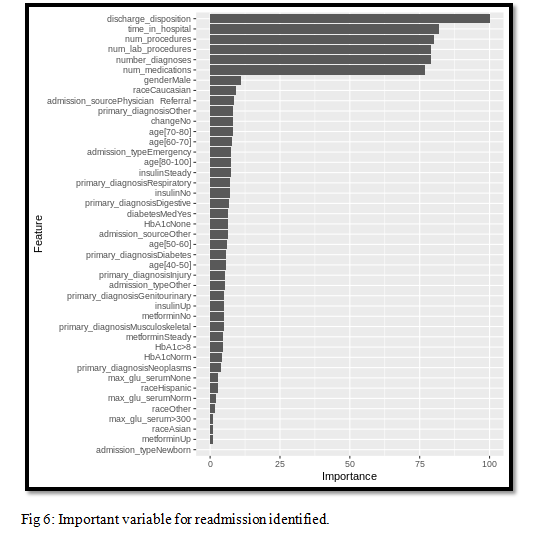 .
.Conclusion
We started with the question from the dataset that what are the factors responsible for the readmission of patients. We then cleaned the data and collapsed the data information wherever required. Moving further we use 3 different classifiers and found that random forest was the best model identified on basis of the accuracy. We also identified the several factors playing a key role in the readmission of patients and some of which include the course of time the patient was admitted for and a number of procedures etc. This study will help in understanding the pattern of readmission of patients and will save a lot of expenditure which is done by the general public in form of readmission.