Frequency Distribution and Probability
The first section involves creating a seven-classes expanded frequency table based on the data given below. Then, we have calculated the measures of central tendencies, measures of variation, and measures of relative standing. The other solutions involve finding probabilities as well as calculating the confidence interval and testing hypotheses.
Constructing and Interpreting a Frequency Distribution Table
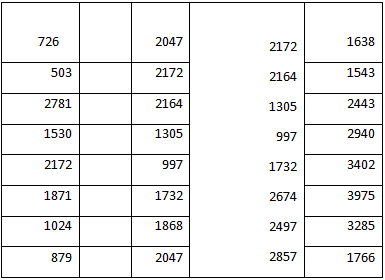
The above table presents the increase of hospitalized COVID-19 patients in the United States between February 1, 2021, to March 7, 2021. Use the above information to answer the questions below
1. Using your knowledge in statistics, indicate the conditions under which this data set is meaningful.
The condition for meaningful data is that the data should give the right quality information that can be used to evaluate the efficiency and effectiveness of our problem or research objectives.
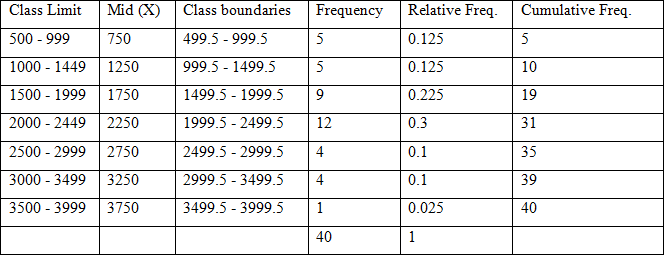
2. Construct an expanded frequency distribution table of the data set using seven classes.
3. How do the different measures of center compare? (mean. Median, mode)
Measure of Center
Mean =∑▒〖X/N=80650/40=2016.25〗
Median : The value of the ((n+1)/2)^thobservation
The value of ((40+1)/2)^th observation
The value of (20.5)^th observation
The value of the 20th observation was 0.5
Therefore, the median is 2047
4. Calculate all the measures of variation of the data set (range, variance, standard deviation)
Measure of Variation
Range: Highest value – Lowest value = 3975 – 503 = 3472
Variance: =∑▒〖((X-X ̅))/N〗^2 =25155308/40=628883
Standard Deviation = √(∑▒〖((X-X ̅ ))/N〗^2 )=√628883=793
Calculating the Measures of Relative Standing
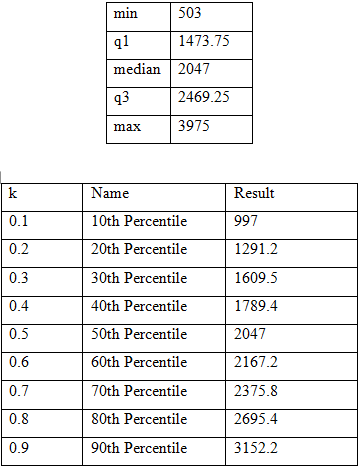
5. Calculate the measures of relative standing (quartiles, fractiles, etc) for the data set and construct its corresponding Boxplot
6. Is this data distribution bell-shaped? Consider all the conditions and support your answer with a graph.
Using the dataset to plot a normal distribution graph, we noticed that there exists a bell shape curve with (mean = 2016.25 and standard deviation = 793).
7. Is it unusual to have 4000 hospitalized COVID-19 patients during the period above mentioned?
It is still usual to have 4000 hospitalized Covid-19 patients during the period mentioned above because from the normal distribution graph, we can see that 4000 is still contained within the chart, therefore it is still usual to have 4000 hospitalized Covid-19 patients.
Probability
8. Find the probability that a randomly selected hospital receives between 2500 and 3500 COVID-19 patients
The probability that a randomly selected hospital receives between 2500 and 3500 COVID-19 patients is given as;
(number of hospitals that received between 2500-3500 Covid-19 patients)/(Total of hospitals that received Covid-19 patients)
=8/40=0.2
Therefore, the probability of covid-19 patients between 2500 and 3500 is 0.2
9. Construct a 99% confidence interval for the population mean. Assume that the data set is normally distributed
99% Confidence Interval
C.I=Mean ±Z×(S.D)/√n
=2016.25±2.576×793/√40
=2016.25±322.99
=(1693.26,2339.24)
Therefore, the 99% confidence interval for the population mean is (1693.26, 2339.24)
Hypothesis Testing
A doctor claims that the average number of hospitalized COVID-19 patients in the US during this period is 2050. Is there enough evidence to reject the claim at∝=0.05 (Identify the claim and state Ho and Ha, find the critical values, identify the rejection region, decide whether to reject or fail to reject the null hypothesis, and interpret the decision in the context of the original claim)
Hypothesis
Null hypothesis:μ=2050
Alternative hypothesis:μ≠2050
Level of significance: α=5%=0.05
Calculation
Mean: 2016.25
Standard deviation = 793
N = 40
Hypothesized mean = 2050
Test statistic : t=(m-μ)/(s/√N)
=(2016.25-2050)/(793/√40)=-33.75/125.3843=-0.26917
Critical value (tα,n-1)=±2.023
Decision: Reject the null hypothesis when the test statistic is greater than the critical value otherwise, you will fail to reject the null hypothesis.
Conclusion: Since the test statistic (0.26917) is less than the critical value, we fail to reject the null hypothesis. This implies that there is no sufficient evidence to support the claim that the average number of hospitalized COVID-19 patients in the US during this period is 2050.
An epidemiologist claims the percentage of the seven classes of hospitalized COVID-19 patients you have constructed above is respectively 13%, 16%, 22%, 34%, 8%, 5%, and 2%. At ∝=0.025 perform a chi-square goodness-of-fit test to test whether to reject, or fail to reject the epidemiologist’s claim
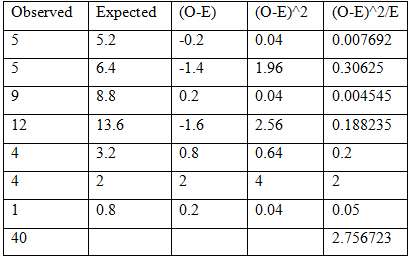
Chi-square goodness of fit =χ^2=∑▒〖〖((O-E))/E〗^2=2.7567〗
Critical value : χ^2 (α,n-1)=23.6543
Decision: Reject the null hypothesis when the Test value is greater than the critical value.
Conclusion: Since the test statistic is less than the critical value, we fail to reject the null hypothesis because we do not have enough evidence to support the epidemiologist claims a percentage of the seven classes of hospitalized COVID-19 patients constructed above is respectively 13%, 16%, 22%, 34%, 8%, 5%, and 2%.