For this assignment, you are required to use the statistical program R.Round all numerical answers to two decimal places and p values to three. The assignment is comprised of two problems. Each problem requires you to calculate the appropriate t-test with R.
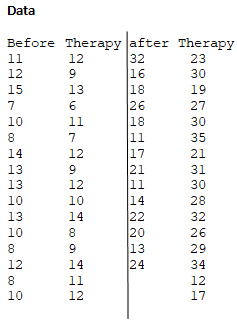
A commonly held belief is that it is always beneficial to one's emotional health to vent one's feelings after a traumatic event. A study attempted to actually test this idea. Researchers tested the Emotional Well Being scores of subjects who had experienced a traumatic event, before and after they received psychotherapy. Perform an appropriate t-test with R to see if there is a difference in the Emotional Well Being scores before and after the psychotherapy.
Finding the t-test and deciding on the hypotheses
Here, the means, standard deviations, and t-tests for the two different sets of data are calculated. Conclusions on hypotheses on each are given, and the results are all explained. The pooled variance is also calculated.
Finding the mean and standard deviation for the first set of participants
1a) what is the Mean for the Before Therapy group?
Answer: 10.875
1b)what is the Standard Deviation for the Before Therapy group?
Answer: 2.390955
1c) what is the Mean for the After Therapy group?
Answer: 10.5625
1d) what is the Standard Deviation for the After Therapy group?
Answer: 2.393568
Deciding on the appropriate test
1e) what type of t-test is required here?
Answer: paired sample t-test
Deciding on the hypothesis
1f) based on your findings; can we reject the null hypothesis? Report your findings using the format below, as demonstrated in the lab. Be sure to clearly state the variables. If there is a significant difference, clarify which direction it is going.
Answer: We cannot reject the null hypothesis. There is not a significant difference in mean between before therapy and after therapy.
t(15)= 0.628 , p= 0.540
Finding the T-Test
1g) Calculate this same t-test by hand. Round to two decimals. You do not have to show your calculations. Just state what you calculated the Standard Error (s_D┴¯ ) to be. (Remember, the Standard Error is the denominator of the t-ratio)
Standard Error (s_D┴¯ ) =1.99
Problem 2
Researchers were interested in which of two methods were best for retention. They had all subjects read a chapter in a textbook. Then, one group of subjects ('Study') was encouraged to study the material for 60 minutes. The other group of subjects (‘Quiz’) was not allowed to study but was actually given a 60-minute quiz on the material. Then, all subjects were required to complete a final test on the material. Perform an appropriate t-test on the final test scores with R to see if there is a difference in performance between the Study and Quiz groups
Finding the mean and standard deviation for the second set of participants
2a) what is the Mean for the Study group?
Answer: 18.7857
2b) What is the Standard Deviation for the Study group?
Answer: 5.950806
2c) What is the Mean for the Quiz group?
Answer: 26.5
2d) what is the Standard Deviation for the Quiz group?
Answer: 6.449806
Deciding on the appropriate test
2e) what type of t-test is required here?
Answer: Independent two-sample t-test
Deciding on the hypothesis
2f) based on your findings; can we reject the null hypothesis? Report your findings using the format below. Be sure to clearly state the variables. If there is a significant difference, clarify which direction it is going.
Answer:
We can reject the null hypothesis. There is a significant difference in the mean between before and after.
T ( 28) = -3.3873, p= 0.002
Finding the Pooled Variance
2g) Calculate the Pooled Variance (s_p^2) for this same t-test by hand. Hint: To save much time, use the Standard Deviations from the R output. Round to two decimals places. You do not have to show your calculations.
Pooled Variance (s_p^2) =6.22
Q3
> #Q1
> Assign3 <- read.delim("C:/Users/CSSC/Downloads/Assign3.txt")
> ETURN<-data.frame(Assign3)
>mean(ETURN$BeforeTherapy,na.rm=TRUE )
[1] 10.875
>sd(ETURN$BeforeTherapy, na.rm = TRUE)
[1] 2.390955
>mean(ETURN$AfterTherapy, na.rm= TRUE)
[1] 10.5625
>sd(ETURN$AfterTherapy)
[1] 2.393568
>t.test(ETURN$BeforeTherapy,ETURN$AfterTherapy,paired = TRUE, na.rm= TRUE)
Paired t-test
data: ETURN$BeforeTherapy and ETURN$AfterTherapy
t = 0.62795, df = 15, p-value = 0.5395
alternative hypothesis: true difference in means is not equal to 0
95 percent confidence interval:
-0.7482174 1.3732174
sample estimates:
mean of the differences
0.3125
> #Q2
>mean(ETURN$Study,na.rm= TRUE)
[1] 18.78571
>sd(ETURN$Study, na.rm=TRUE)
[1] 5.950806
>mean(ETURN$Quiz, na.rm=TRUE)
[1] 26.5
>sd(ETURN$Quiz, na.rm=TRUE)
[1] 6.449806
>t.test(ETURN$Study,ETURN$Quiz, na.rm=TRUE)
Welch Two Sample t-test
data: ETURN$Study and ETURN$Quiz
t = -3.4061, df = 27.907, p-value =
0.002016
alternative hypothesis: true difference in means is not equal to 0
95 percent confidence interval:
-12.354269 -3.074302
sample estimates:
mean of x mean of y
18.78571 26.50000