Using variables to get the solution
Here, we are using all variables, i.e. continuous, nominal, and ordinal to get data values. We will also identify the data errors.
Questions
1. Identify two continuous variables in the dataset. Calculate and report the appropriate statistics for all of these variables, as specified in the lecture. Report the statistics following the example below.
2. Identify two nominal variables in the output. Calculate and report the appropriate statistics for these variables, as specified in the lecture. Report the statistics following the example below.
3. Identify two ordinal variables in the output. Report the appropriate statistics for these variables, as specified in the lecture. Report the statistics following the example below
4. Do any of the variables show data entry errors? If so, which one(s)? How do you know there is a data entry error?
5. Based on your interpretation of the data, do respondents think social workers are beneficial? Support your answer with the data. Should this be interpreted with caution? Why or why not?
6. Based on your interpretation of the data, how useful were the resources provided to people who have received services? Support your answer with the data. Should this data be interpreted with caution? Why or why not?
7. Describe the distributions of the continuous variables. Are they normal? Are any of them skewed positively or negatively? If they are skewed, how do you know they are skewed?
Solutions
1.
Two continuous variables are:
- Q2: How long have you practiced as a social worker?
- Q16: What is your age in years?
Social worker’s experience ranged from 1 to 27 years (M=7.5 years, s.d.=6.86) and the age of respondents in the sample ranged from 14 to 74 years (M=36.31, s.d.=13.57)
2.
Two nominal variables are:
- Q1: Are you a social worker?
- Q9: I have considered a career in the social work profession.
Results indicated that 88% (n=304) of the respondents were social workers and 91% (n=314) of the respondents in the sample have considered a career in the social work profession.
3.
Two ordinal variables are:
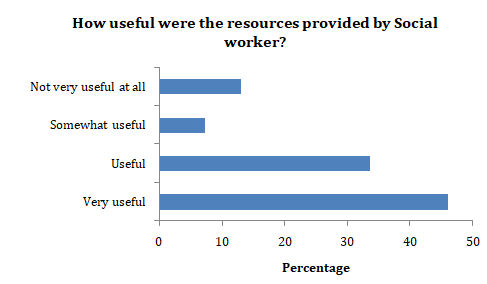
- Q4b: How useful were the resources provided by the social worker?
- Q5: How would you rate your overall experiences with a social worker?
Results indicated that 46% (n=63) of the respondents were very useful were the resources provided by the social worker, 34% (n=46) were useful, 7% (n=10) were somewhat useful and 13% (n=18) were not useful.
Results indicated that 3% (n=4) of the respondents rated “very bad” as the overall experiences with a social worker, 4% (n=5) rated “bad”, 17% (n=22) rated “average”, 45% (n=58) rated “good” and 32% (n=41) rated “very good” as the overall experiences with a social worker.
4.
For Q3: “How frequently do you interact with social workers?” which had four options ranging from 0 to 4 in the question were also entered 5 as the answer by case IDs: 268, 280, 309, and 320.
For Q4: “Have you ever received services from a social worker?” which had two options: 0 (Yes) and 1(No) in the question were also entered 2 as the answer by three case IDs namely: 221, 268, and 280.
One of the respondents for Q4a answered 2 and another one answered 10 which is not the correct answer to the question.
One of the respondents for Q7 answered 100 which is not the correct answer to the question.
5.
There are many questions in the survey that answer this question in one way or the other and the descriptive statistics for all these questions are provided in the table below. It can be seen that the values of all the three measures of central tendency are close to 3 which means “good” for the overall experiences with a social worker. However, the survey does not include a respondent which has rated “very bad” and “very good”. Values of all the three measures of central tendency are more than 8 for “overall view of social work profession” suggesting a “positive” view. With regard to the importance of the profession, measures of central tendency are greater than 8.5 suggesting quite an importance. All the three measures of central tendency for the questions regarding the importance of Hospice, hospital, school, mental health centers are greater than 4 suggesting social workers are important and for prison and non-profit management, the mean is greater than 3.5 indicating between close to important.
Thus, all the questions indicate that social workers are quite beneficial.
| How would you rate your overall experiences with a social worker? | On a scale of 1 - 10, what is your overall view of the social work profession? | On a scale of 1 - 10, how important is the social work profession to the community? | How important is it to have a social worker in the following environment: Hospice | How important is it to have a social worker in the following environment: Hospital | How important is it to have a social worker in the following environment: Prison | How important is it to have a social worker in the following environment: School | How important is it to have a social worker in the following environment: Mental Health Centers | How important is it to have a social worker in the following environment: Non-profit Management | |
| Mean | 2.98 | 7.88 | 8.73 | 4.16 | 4.25 | 3.78 | 4.15 | 4.41 | 3.65 |
| Median | 3 | 8 | 9 | 4 | 5 | 4 | 4 | 5 | 4 |
| Mode | 3 | 10 | 10 | 5 | 5 | 5 | 5 | 5 | 5 |
| Std. Dev | 0.96 | 2.15 | 5.34 | 1.022 | 1.015 | 1.31 | 1.08 | 0.90 | 1.31 |
| Minimum | 0 | 1 | 0 | 0 | 0 | 0 | 0 | 0 | 0 |
| Maximum | 4 | 10 | 100 | 5 | 5 | 5 | 5 | 5 | 5 |
6.
More than 75% of the respondents in the survey feel that the resources provided to people who have received services were either “useful” or “very useful” as can be seen from the histogram provided below. But it should be noted that about 207 respondents have not answered the question which comprises about 60% of the respondents in the survey.
Ans.
7.
Histograms for both the variables show that none of these is close to normal.
The mean value of the Q2 and Q16, two continuous variables, is larger than the median value which suggests that the data is positively skewed. It can also be confirmed from the positive skewness values for the two variables i.e. 1.5 and 0.7 respectively. It can also be seen from the larger side tail in the histograms for both variables.
Ans.
| Q2 | Q16 | |
| Mean | 7.5 | 36.30814 |
| Median | 5 | 32 |
| Mode | 1 | 24 |
| Std Dev | 6.859394 | 13.57447 |
| Sample Variance | 47.05128 | 184.2663 |
| Kurtosis | 1.772852 | -0.53979 |
| Skewness | 1.496658 | 0.695222 |