Interpreting data analysis results using ANOVA
Here, we use ANOVA to analyze mean scores for quiz 3. We will then use variables to carry out a data analysis plan. We will then interpret all the results and give a conclusion.
Task
Data Analysis and Application (DAA) Template
Data Analysis Plan
1. Name the variables and the scales of measurement.
2. State your research question, null and alternate hypothesis.
Testing Assumptions
1. Paste the SPSS output for the given assumption.
2. Summarize whether or not the assumption is met.
Results & Interpretation
1. Paste the SPSS output for the main inferential statistic(s) as discussed in the instructions.
2. Interpret statistical results as discussed in the instructions.
Statistical Conclusions
1. Provide a brief summary of your analysis and the conclusions drawn.
2. Analyze the limitations of the statistical test.
3. Provide any possible alternate explanations for the findings and potential areas for future exploration.
Application
1. Think of your own field of study. Describe how this type of analysis might be used in your field.
2. Analyze what the value and potential implication of such an analysis would be.
Solution
ANOVA
One-Way ANOVA was used to analyze whether the mean quiz 3 scores among sections were the same or different. A test for normality of dependent variable was also performed to test for normality assumption.
Data Analysis Plan
The variables used in this analysis are Quiz3 – number of correct answers in quiz 3, Section –Section of the student. QUIZ3 is a scale variable, and although they are discrete, they are quantitative in nature, and we will treat the variable as a continuous scale variable. A section is a nominal variable with 3 categories.
The research questions in this work are:
Is there a significant difference between mean scores inQUIZ3among students of different sections?
The null hypothesis is that there is no difference between pair males and females in terms of the previous grades.
The hypothesis can be specified mathematically as:
Hypothesis 1:μ_1,μ_2, and μ_3represents the population means of previous QUIZ3 for the three sections respectively
H_0: μ_1= μ_2=μ_3 vs H_1: Not all means are the same
The alternative hypothesis is that at least a pair of means differ.
Testing Assumptions
The descriptive statistics obtained from SPSS is below:
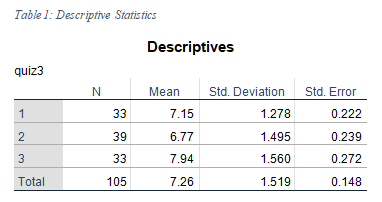
The above table summarizes the mean and standard deviation of the quiz 3 scores in 3 sections. The average score of section 1 was M=7.15 (SD = 1.278), section 2 was M=6.77 (SD = 1.495), and for section 3 M = 7.94 (SD = 1.560). The means do not appear close to each other although the standard deviation seems close.
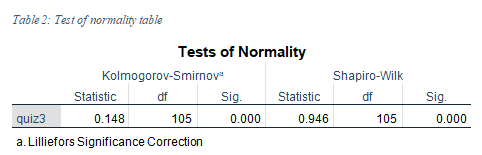
The normality assumption for variables was not met for QUIZ3 as the Shapiro-Wilk test gives a statistically significant result, stat.= 0.946,p<.001. This was expected as the quiz 3 variable is discrete in nature and only takes integral value.
Results & Interpretation
The one-way ANOVA results obtained from the SPSS table is given below:
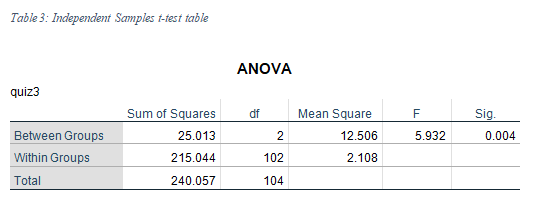
The ANOVA table clearly outlines that there is insignificant evidence for a significant difference between the QUIZ3score between different sections, F=5.932; p = .004. Hence, the null hypothesis of no difference was rejected. It was concluded that the mean score of the 3 sections was not the same.
Since the null hypothesis was rejected, a post-hoc comparison was run to check which pair of differences were significant.
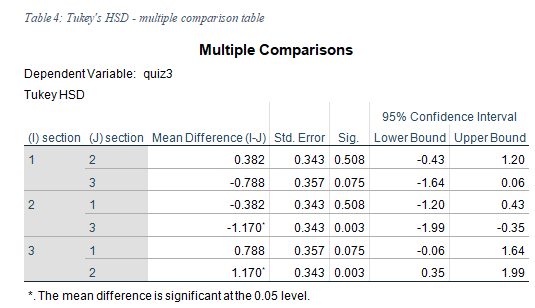
The multiple comparison table shows that the pair which had significant differences in mean was Section 2, and 3 with 95% confidence interval for the difference being [-1.99, -0.35]. Hence, it was concluded that the average quiz 3 scores of sections 2 and 3 were significantly different but not that of sections 1, and 2; and that of section 1, and 3.
Statistical Conclusions
The results that were obtained in the previous part show that there is significant evidence for the difference between QUIZ3 scores among the 3 sections. The main assumptions of ANOVA were not satisfied making the result a bit unreliable. It is concluded that the average of section 2 was different from section 3, but other pairs were not significantly different.
Application
ANOVA is an extremely useful and powerful tool to determine the differences between the more than two classes. It is of prime importance in many fields and used to strengthen the empirical evidence. In Finance, it can be used to test if different sectors have different annualized returns. In medical sciences, it can be used to test the effectiveness of more than 2 treatments using a randomized experimental design. It has very sound theoretical support and the application of ANOVA can be seen across disciplines.