Interpreting Cox Regression
Here we will use cox regression to estimate survival time for cancer patients in relation to the stage.
Question 1
Kardaun (1983) reports data on 90 males diagnosed with cancer of the larynx during the period 1970 — 1978 at a Dutch hospital. Times recorded are in years between the first treatment and either death or the end of the study (January 1, 1983). Also recorded are the patient’s age at the time of diagnosis, the year of diagnosis, and the stage of the patient’s cancer. The four stages of disease in the study were based on the T.N.M. (primary tumor (T), nodal involvement (N), and distant metastasis (M) grading) classification used by the American Joint Committee for Cancer Staging (1972). The four groups are Stage I, TINOMO with 33 patients; Stage II, T2N0M0 with l7 patients; Stage III, T3N0M0 and TxNlM0, with 27 patients; z = 1, 2, or 3; and Stage IV, all other TNM combinations except TIS with 13 patients. The stages are ordered from least serious to most serious. The data can be found on the course website.
(a) Fit a Cox PH model to investigate the association of survival time with stage and age without an interaction. Define all terms.
(b) What is the estimated hazard ratio (HR) for death associated with an Age of 50 as compared to an age of 60, holding all other covariates constant?
(c) What is the estimated hazard ratio (HR) for death associated with a Stage III cancer as compared to a Stage IV cancer, holding all other covariates constant?
(d) Based on this model, calculate the estimated hazard ratio of death for a patient aged 60 with Stage III cancer versus a patient aged 50 with stage cancer.
(e) Is there an interaction effect between age and cancer stage?
Question 1 solution:
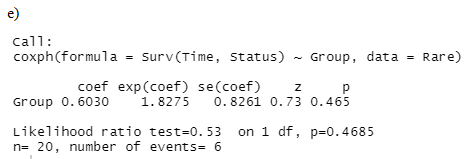
a) The Cox regression results can be interpreted as follow:
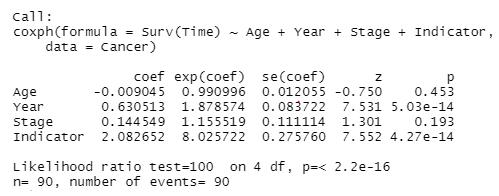
The table above represents the cox proportional hazard model regression output. The z column gives the Wald statistic value. It corresponds to the ratio of each regression coefficient to its standard error. The Wald statistic evaluates, whether the beta (β) coefficient of a given variable is statistically significantly different from 0. From the output above, we can infer that the variables Year and Indicator have highly statistically significant coefficients. The column for the regression coefficients of the variables indicates that the hazard rates for variables; Year, Stage, and Indicator are high. The p-values gotten from the Likelihood ratio test, Wald test and log-rank test all indicate the significance of the model at 0.05 level of significance.
b) The estimated hazard ratio for death associated with an age of 50 as compared to an age of 60, holding all other covariates constant is 0.9979552.
c) The estimated hazard ratio for death associated with a stage III cancer as compared to stage IV cancer, holding all other covariates constant is 1.003341.
d) The estimated hazard ratio of death for a patient aged 60 with stage III cancer versus a patient aged 50 with stage IV cancer is 1.005376.
e) Because the hazard ratio obtained in d is greater than 1, it implies an interaction effect between the ages of patients and their cancer stages.
Question 2
Survival Analysis Example: The numbers below represent the survival times in years for two groups with a rare disease. The values with (+) are censored. Use the values to answer the following questions.
Group 0: l.33a, 2.21, 2.80a, 3.92.5.44a, 9.99, 12.01, 12.07, 17.31, 28.65
Group 1: 0.122+, 0.43, .64, 1.58, 2.02, 3.08, 3.62a, 4.33, 5.52+, 11.86.
(a) Show how to find the Kaplan-hleier estimates of the survival curves for these two groups and sketch the first few values. Does it appear that one group does better than the other? Plot the survival curves in one graph.
(b) Give the estimated 3-year survival probabilities, fi (3) and fi2(3) based on these data along with the corresponding confidence intervals.
(c) Estimate the median survival time for people in these two groups.
(d) Test whether there is a difference in 3-year survival probability for these two groups.
(e) Perform a test to compare survival times between these two groups. Explain what hypotheses are being tested and give your real-world conclusions.
(f) Perform a regression analysis for this data set by treating the Group as one covariate. Compare your results with results obtained in (e) and draw your conclusions
Question 2 solution
Survival analysis
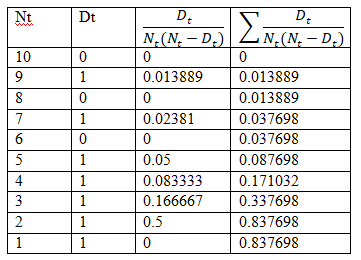
a) Calculation of the Kaplan-Meier Estimate for the two groups
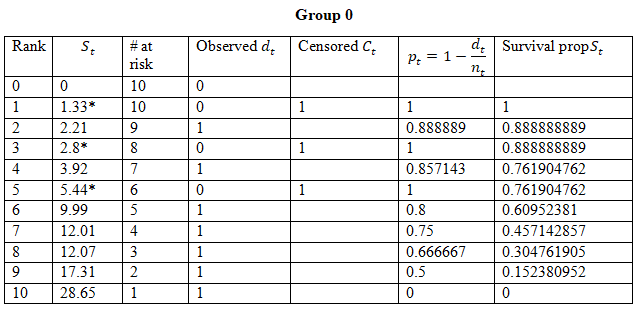

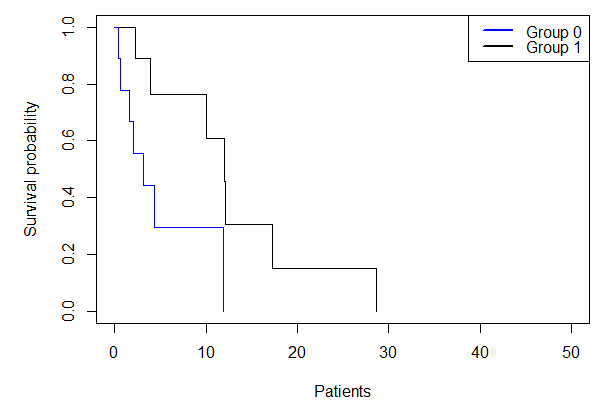
From the graph and estimated probabilities for the survival time of patients, we see that Group 1 has a better survival probability than group 0.
b) Estimated 3-year survival probability
S_1 (3)=P_1×P_2×P_3
=1×0.8889×1=0.8889
S_2 (3)=P_1×P_2×P_3
=1×0.8889×0.875=0.7778
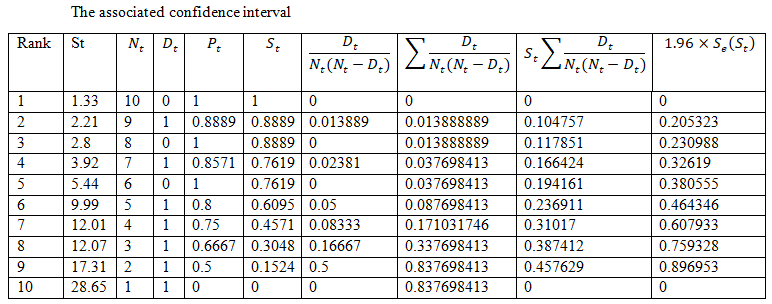
The confidence interval for S_0 (3)=0.8889±0.23099
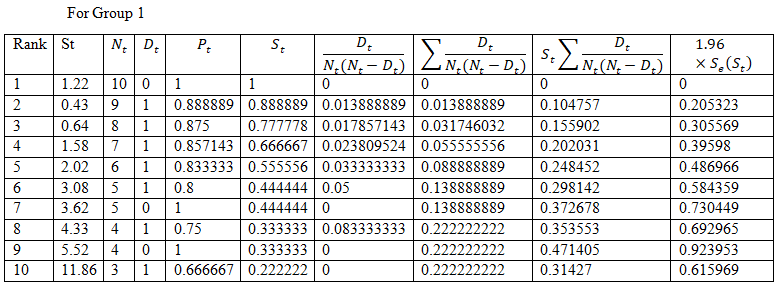
The confidence interval for S_1 (3)=0.7778±0.3055
c) The median survival time for people in the two group
Group 0
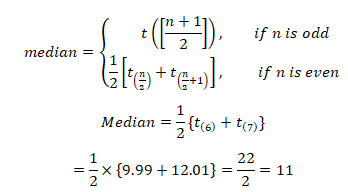
Group 1
=1/2×{3.08+3.62}=6.70/2=3.35
d) Test for difference in the 3-year survival probability of the two groups
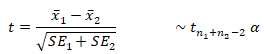
Using
e)
H_0:Survival time is the same between the two groups
H_1:Survival time is not the same between the two groups
α=0.05
Test statistic
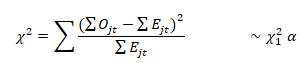
Decision rule: reject H_0 if χ_cal^2>χ_tab^2
Accept if otherwise
Calculation
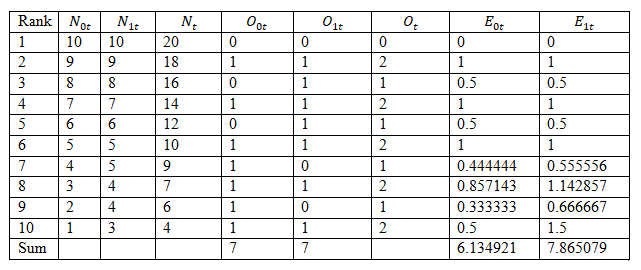
where
N_0t=Number of people at risk in group 0
N_1t=Number of people at risk in group 1
O_0t=Observed number of death in group 0
O_1t=Observed number of death in group 1
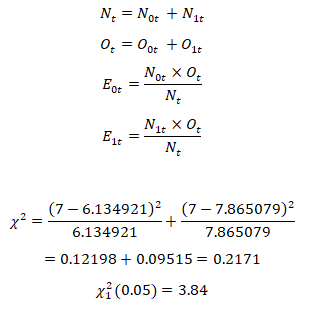
Conclusion
Since χ_cal^2 (0.2171)≯χ_tab^2 (3.84), we conclude that we do not have enough evidence to reject the null hypothesis and this implies that there is no significant difference between the survival time in years of patients in group 0 and patients in group 1 at 0.05 level of significance
From the R-output displayed above, the p-value associated with the regression model suggests that we do not have enough evidence to conclude that there is a significant difference between the survival times of patients in the two groups.
Question 3
In planning a survival study to compare the survival of time between two treatment groups, we want todetecta2OYcimprovement in the median survival from or months to 6 months with 50% power a to=ñ. for, and we plan on following patients for 1 year (12 months). Based on the exponential assumption for survival distributions and 1 to 1 equal allocation of patients receiving either treatment A or treatment B, how many patients do we need to recruit for this study?
1. The following table gives data from patients on a study to examine the possible benefit of the kidney transplant
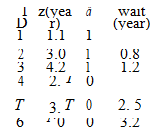
where z is the observed survival or censoring time measured from the beginning of the study, d is the death indicator (1 for death and 0 for censoring) and wait is the time in years that a patient waited to get a kidney transplant (missing means a patient did not get a transplant). Assume the following model for evaluating the possible benefit of the kidney transplant:
2(t|transplanthistory) Ab(I)exp(Jz,(t)),
where z,(I) = 1 if patient I already received a kidney transplant at the time I and z,(I) = 0 otherwise, and I is measured as time from the entry into the study. Based on the above model, fit a regression model with time-dependent covariate wait and draw your conclusions based on the model fitting results.
Question 3 Solution
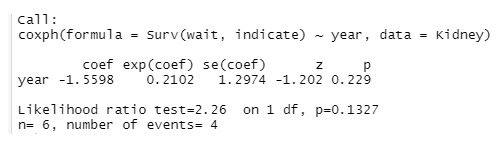
The result from the regression analysis shows that both the model and the explanatory variables have no significant impact at 0.05 level of significance.
Question 4
In planning a survival study to compare the survival of time between two treatment groups, we want to detect a 2OYc improvement in the median survival from or months to 6 months with 50% power a to = ñ. for, and we plan on following patients for 1 year (12 months). Based on the exponential assumption for survival distributions and 1 to 1 equal allocation of patients receiving either treatment A or treatment B, how many patients do we need to recruit for this study?
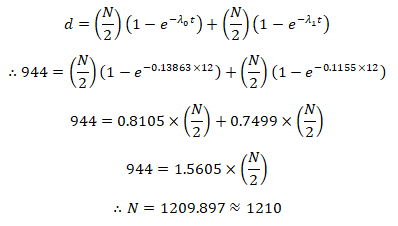
Question 4 solution
If
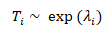
then
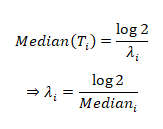
It follows that
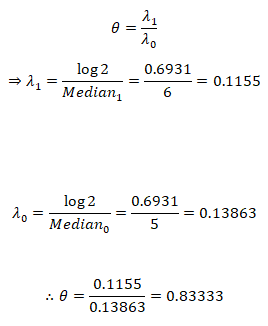
For a 2-arm study, to detect a hazard ratio of 0.83333 with 80%power at a 2-sided significance level of α = 0:05, we need the number of events
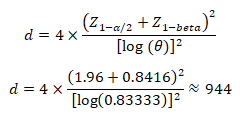
Using