Correlation and Different Coefficients
Class Assignment #7
1. For each of the following examples, describe how the variables are related to one another (e.g., the direction in which they each move).
a. A correlation of -0.87
As one variable increases, the other variable decreases
b. A correlation of +0.45
As one variable increases, the other variable increases.
c. A correlation of -0.75
As one variable increases, the other variable decreases
2. Of the three correlations presented in 1a through 1c, which is the strongest? Why?
The correlation of -0.87 is the strongest as its magnitude is the largest amongst the three correlations.
3. What is the coefficient of determination for a Pearson correlation of -0.60? For full credit, show your work and explain what this value means.
Coefficient of determination = R2 = (-0.6)2 = 0.36
Therefore, it can be concluded that 36% of the variance in one variable is explained by the other variable.
4. For each of the following scenarios, indicate which correlation you should run and why.
a. You are examining whether there is a correlation between GPA (on a 4.00 scale) and age. What type of correlation should you run and why?
Pearson’s correlation coefficient can be used as the two variables are continuous variables.
b. You are examining whether there is a correlation between gender (defined as male/female) and upper body strength (measured by how many pounds the participant can deadlift).
Point biserial correlation coefficient can be used to measure the correlation between gender and upper body strength as one of them is a categorical variable and the other variable is a continuous variable.
c. You are examining whether there is a correlation between class performance (defined as pass/fail) and year in college (first year versus the fourth year).
Cramer’s V can be used to measure the correlation between class performance and year in college as they are both categorical variables.
d. You are examining whether there is a correlation between class performance (defined as final points earned in a class in a range of 0 – 500) and the number of classes missed during the semester.
Pearson’s correlation coefficient can be used as the two variables are continuous variables.
5. A researcher completes a study and finds that there is a positive correlation between studying and GPA. Does that mean that studying causes a change to one’s GPA? Why or why not? In your explanation of why include how the concept of a third variable relates to your conclusion as well as why you think that third variable would be related to the original two variables.
The positive correlation between studying and GPA indicates, more hours spent studying is associated with a greater GPA. It doesn’t mean that more studying will necessarily lead to a higher GPA. A third variable such as prior experience with the subject, household income, etc may influence the GPA, as students with better knowledge about a course are likely to do better and students from higher-income households may be able to afford extra classes/help on the side to help them with the study. Thus, correlation doesn’t equal causation.
6. If a researcher decides that they want to examine how the number of children living in a household relates to parental stress, but limits their study to households that have no more than 3 children, how could that decision impact the results of the analysis and correlation?
The sample limits itself to households that have no more than 3 children. By limiting the sample, it loses a part of the population from being represented in the sample. It may reduce the correlation, as parents with more than 3 children in the household may experience higher parental stress.
Lab Assignment #6
Lab Assignment #6 requires you to utilize the SPSS database titled “Creativity” that is available on Sakai as an attachment with this assignment. The database includes hypothetical data for a study examining variables that may be related to creativity. For this assignment, you must include your output in addition to answering the questions below.
Information regarding the database: Prior research suggests that various traits may be associated with creativity, including personality traits and intelligence. Although prior research suggests that intelligence is positively correlated with creativity, research has provided inconsistent results with regards to the potential relationship between measures of achievement, such as GPA, and creativity. The database provided includes hypothetical data examining the relationship between personality factors, intelligence, creativity, and GPA.
In this database, creativity was measured using the Inventory of Creative Activity and Achievement (ICAA) which is a self-report instrument where participants answer a series of questions related to their creative activities and how creative they perceive themselves to be. Scores on the ICAA range from 0 – 208, with higher scores indicating higher perceived levels of creativity. Intelligence was measured using a standardized instrument, with 100 being the average score for intelligence. The database also includes information regarding personality traits, extraversion, and agreeableness. Both traits were measured on a 7-point scale, where higher scores indicated a strong degree of personality traits and lower scores indicated a low degree of the trait. Finally, participants’ high school GPAs were reported, using a 4-point scale.
1. Describe the type of relationship that prior research suggests exists between intelligence and creativity according to the prompt. Your response should include the type of relationship described as well as an explanation of what that type of relationship means (e.g., what a positive or negative relationship means).
Prior research suggests intelligence is likely to have a positive correlation with creativity, which means individuals with higher levels of intelligence are likely to have greater creativity.
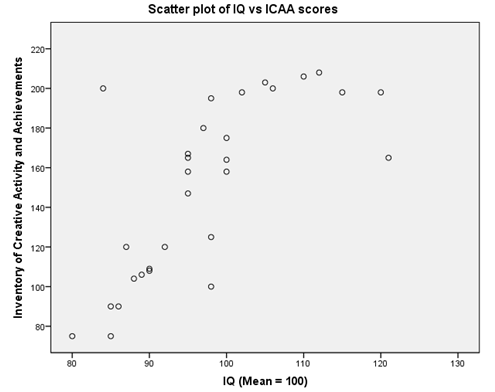
2. Create a scatterplot to examine the potential relationship between intelligence and scores on the ICAA.
a. Does the scatterplot suggest that there are any outliers? How did you determine this and how could the outlier(s) influence the results of the correlation?
The scatterplot shows there is a positive correlation between IQ scores and scores on the ICAA. The scatterplot shows the points are scattered close to an upward sloping line, which suggests that there is a positive correlation between the two variables. There are two outliers in the graph. The two outliers lie on the opposite sides of the imaginary upward sloping line and are likely to cancel out each other’s impact on the results of the correlation.
b. Include a copy of the output for the scatterplot in your submission.
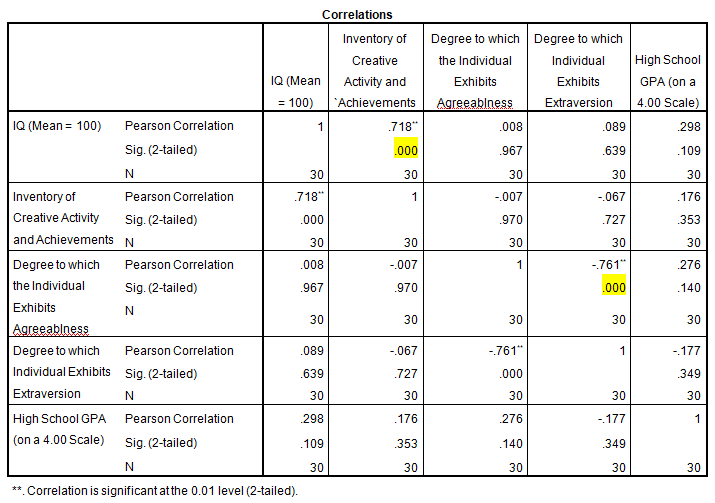
3. Conduct a correlational analysis using all of the variables in the database.
a. Which correlations are significant? List each of them here and indicate whether the correlation is positive or negative for each.
The correlation between IQ and ICAA scores is equal to 0.718 and the degree to which an individual exhibits agreeableness and the degree to which an individual exhibits extraversion is equal to -0.761. These two pairs of correlations are statistically significant.
b. Which correlations are not significant? List each of them here.
The correlations between IQ &the degree to which individual exhibits agreeableness, IQ °ree to which individual exhibits extraversion, IQ & high school IQ, ICAA scores &the degree to which individual exhibits agreeableness, ICAA scores °ree to which individual exhibits extraversion, ICAA scores & high school IQ, the degree to which individual exhibits agreeableness& high school IQ and the degree to which individual exhibits extraversion& high school IQ have correlations are not statistically significant.
c. Include a copy of the output for this analysis
4. Provide a summary of the results in APA format. For full credit, the response must be typed so that APA formatting can be checked.
The Pearson’s correlation coefficient was computed to measure the degree of association between intelligence and various factors such as creativity, agreeableness, extraversion, and high school GPA scores of individuals. Results show that the correlation between IQ and ICAA scores is equal to 0.718 and the degree to which an individual exhibits agreeableness and the degree to which an individual exhibits extraversion is equal to -0.761. These two pairs of correlations are statistically significant and other pairs of variables don’t show statistically significant correlation.