Problem Description:
The aim of Principal Component Analysis In R homework is to explore the relationships between various economic variables and perform Principal Component Analysis (PCA) to understand the underlying structure of the data. Our dataset consists of eight economic variables: Food, Cloth, Resid, HousF, Health, TranC, Educ, and Miscel.
Solution
1(a). Correlation between variables:
Food Cloth Resid HousF Health TranC Educ Miscel
Food 1
Cloth 0.26 1
Resid 0.71 0.4 1
HousF 0.72 0.45 0.77 1
Health 0.39 0.58 0.69 0.58 1
TranC 0.9 0.36 0.79 0.78 0.47 1
Educ 0.83 0.54 0.81 0.89 0.63 0.88 1
Miscel 0.72 0.63 0.72 0.72 0.63 0.75 0.84 1
P-VALUE OF CORRELATION MATRIC
Food Cloth Resid HousF Health TranC Educ Miscel
Food 0.1626 0.0000 0.0000 0.0324 0.0000 0.0000 0.0000
Cloth 0.1626 0.0239 0.0103 0.0007 0.0481 0.0016 0.0002
Resid 0.0000 0.0239 0.0000 0.0000 0.0000 0.0000 0.0000
HousF 0.0000 0.0103 0.0000 0.0006 0.0000 0.0000 0.0000
Health 0.0324 0.0007 0.0000 0.0006 0.0081 0.0002 0.0002
TranC 0.0000 0.0481 0.0000 0.0000 0.0081 0.0000 0.0000
Educ 0.0000 0.0016 0.0000 0.0000 0.0002 0.0000 0.0000
Miscel 0.0000 0.0002 0.0000 0.0000 0.0002 0.0000 0.0000
Interpretation: There is significant correlation between all variables except food and cloth.
b) For principal component analysis either covariance matric or correlation matrix is possible. The difference between them is only in data pre-processing. If the matrix is centered but not scaled, its PCA of the covariance matrix. The PCA of correlation matrix was computed as singular value decomposition of column centered, scaled matrix.
For this assignment let proceed to – PCA with correlation matrix
c) Result of performed PCA using R
PC1 PC2 PC3 PC4 PC5
Food -0.3529911 0.42928651 -0.17543240 0.29872838 -0.00560897
Cloth -0.2495530 -0.67695648 -0.52091532 -0.09658973 0.39814884
Resid -0.3709478 0.05620474 0.44150056 0.07047522 0.58892053
HousF -0.3738247 0.08844179 0.07324417 -0.78940954 -0.25985063
Health -0.3015777 -0.47168317 0.62781292 0.22597502 -0.25311203
TranC -0.3760828 0.32419614 -0.12268623 0.12654342 0.27873101
Educ -0.4040119 0.06966587 -0.08995771 -0.19992907 -0.13226521
Miscel -0.3743799 -0.11840869 -0.28335470 0.40773524 -0.51753796
PC6 PC7 PC8
Food 0.37675460 -0.65134636 0.06976856
Cloth 0.13320574 -0.13409455 0.06725512
Resid -0.53048320 -0.16662669 -0.05783575
HousF -0.06553027 -0.11670387 0.37210836
Health 0.41323273 0.03605416 0.07228562
TranC 0.27077814 0.69470347 0.29794079
Educ 0.08592665 0.15644120 -0.85703307
Miscel -0.55058159 0.08941841 0.14247766
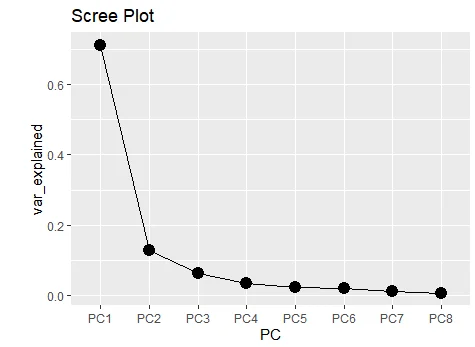
d) What percentage of variability explained by each PCA? Also cumulative percentages of variance? also scree plot?
Importance of components:
PC1 PC2 PC3 PC4 PC5 PC6
Standard deviation 2.3877 1.0141 0.71026 0.5223 0.43138 0.40171
Proportion of Variance 0.7127 0.1286 0.06306 0.0341 0.02326 0.02017
Cumulative Proportion 0.7127 0.8412 0.90426 0.9384 0.96163 0.98180
PC7 PC8
Standard deviation 0.29539 0.24157
Proportion of Variance 0.01091 0.00729
Cumulative Proportion 0.99271 1.00000
PC1 explained 71.27% of variance, PC2 explained 12.86%of variance.
Cumulative percentages of variance or proportion of PC1 and PC2 explained is 84.12%
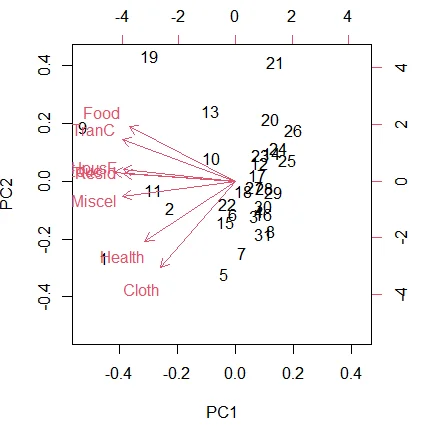
e) linear combination of original data
PC1 = -0.35Food -0.24Cloth -0.37HousF – 0.30Health -0.37TranC – 0.40 Educ- 0.37 Miscel
Educ, Miscel, TranC, HousF has biggest role in the construction of PC1
PC2 = 0.42 Food – 0.67 Cloth + 0.05Resid + 0.08 HousF – 0.47Health + 0.32 TranC + 0.06Educ – 0.11Miscel
Cloth,Food,Health has biggest role in the construction of PC2.
f) Biplot of the first 2 PCA