Problem Statement
The Acme Drug Company has developed a new drug designed to prevent colds, and they want to evaluate its effectiveness for both men and women. To investigate this, the company conducts a study using a simple random sample of 100 women and 200 men. At the end of the study, 38% of the women and 51% of the men caught a cold. The objective of this analysis is to answer the research question regarding the cold prevention effectiveness of the new drug in both men and women.
Solution
From the initial information we know that the estimated difference in the proportion of men minus women catching a cold is 0.13 (0.13 = 0.51-0.38). Note that JMP may give the estimated difference in proportions as women - men (i.e. -0.13 = 0.38-0.51). What are the lower and upper bounds of the corresponding 95% CI for the probability of a man minus woman catching a cold (rounding to the nearest hundredth)?
LCL =0.01
UCL =0.25
DOSE RESPONSE FALL 2021 QUIZ
| Dose | Response Response | Count | In ( dose ) |
|---|---|---|---|
| 0.125 | Negative | 10 | -2.07944 |
| 0.125 | Positive | 2 | -2.07944 |
| 0.25 | Negative | 8 | -1.38629 |
| 0.25 | Positive | 4 | -1.38629 |
| 0.5 | Negative | 6 | -0.69315 |
| 0.5 | Positive | 6 | -0.69315 |
| 1 | Negative | 3 | 0 |
| 1 | Positive | 7 | 0 |
| 2 | Negative | 2 | 0.693147 |
| 2 | Positive | 8 | 0.693147 |
| 4 | Negative | 1 | 1.386294 |
| 4 | Positive | 8 | 1.386294 |
| 8 | Negative | 1 | 2.079442 |
| 8 | Positive | 7 | 2.079442 |
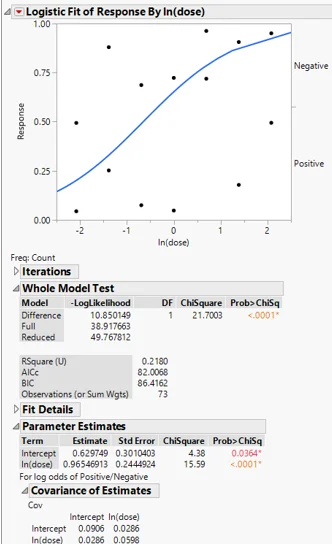
1. Use the dataset “Dose response Fall 2021 Quiz” for this problem. A pre-clinical dose response study was conducted to understand the dose-response of a particular molecule. It is hypothesized that as the dose increases (over the range tested), the likelihood/probability of a positive response will increase. Approximately 12 mice were tested per dose and the outcome (positive/negative) was recorded. Conduct a logistic regression, using ln(dose), to assess the relationship between dose and outcome. Note: The following should happen automatically but, if not, you will need to use the “freq” option (use the variable ”count”).
Which of the following is true (check all that apply)?
Group of answer choices
- True
The probability of having a positive outcome increases with ln(dose) (and therefore, dose)
- True
We fail to reject the null hypothesis of no relationship at alpha=0.05
- False
The probability of having a negative outcome increases with ln(dose) (and therefore, dose)
- True
The relationship is statistically significant at alpha = 0.05
2. Use the dataset “Dose response Fall 2021 Quiz” for this problem. A pre-clinical dose response study was conducted to understand the dose-response of a particular molecule. It is hypothesized that as the dose increases (over the range tested), the likelihood/probability of a positive response will increase. Approximately 12 mice were tested per dose and the outcome (positive/negative) was recorded. Conduct a logistic regression, using ln(dose), to assess the relationship between dose and outcome. Note: The following should happen automatically but, if not, you will need to use the “freq” option (use the variable ”count”).
What is the value of the Odds Ratio corresponding to a 1 unit increase in log dose (e.g. the odds of having a positive outcome for a ln(dose) of 1 to the odds of having a positive outcome for a ln(dose) of 0)(round to the nearest hundredths)?
2.63
Ans: e^0.9655=2.626=2.63
3. Use the dataset “Dose response Fall 2021 Quiz” for this problem. A pre-clinical dose response study was conducted to understand the dose-response of a particular molecule. It is hypothesized that as the dose increases (over the range tested), the likelihood/probability of a positive response will increase. Approximately 12 mice were tested per dose and the outcome (positive/negative) was recorded. Conduct a logistic regression, using ln(dose), to assess the relationship between dose and outcome. Note: The following should happen automatically but, if not, you will need to use the “freq” option (use the variable ”count”).
What is the estimated probability of having a positive outcome for a dose of 8 (round to the nearest thousandth’s place)?
Odds = e^(0.629749+0.965469×ln(8) )=13.97661
Probability = 13.97661/(1+13.97661) = 0.933
The required probability is 0.933
Use the dataset “Dose response Fall 2021 Quiz” for this problem. A pre-clinical dose response study was conducted to understand the dose-response of a particular molecule. It is hypothesized that as the dose increases (over the range tested), the likelihood/probability of a positive response will increase. Approximately 12 mice were tested per dose and the outcome (positive/negative) was recorded. Conduct a logistic regression, using ln(dose), to assess the relationship between dose and outcome. Note: The following should happen automatically but, if not, you will need to use the “freq” option (use the variable ”count”).
What is the estimated probability of having a positive outcome for a dose of 0.125 (round to the nearest thousandth’s place)?
Odds = e^(0.629749+0.965469×ln(0.125) )=0.252111
Probability = 0.252111/(1+0.252111) = 0.201
The required probability is 0.201
Use the dataset “Dose response Fall 2021 Quiz” for this problem. A pre-clinical dose response study was conducted to understand the dose-response of a particular molecule. It is hypothesized that as the dose increases (over the range tested), the likelihood/probability of a positive response will increase. Approximately 12 mice were tested per dose and the outcome (positive/negative) was recorded. Conduct a logistic regression, using ln(dose), to assess the relationship between dose and outcome. Note: The following should happen automatically but, if not, you will need to use the “freq” option (use the variable ”count”).
Compute the odds ratio corresponding to the odds of a positive outcome for a dose of 8 to the odds of a positive outcome for a dose of 0.125. Make sure to use at least 3 significant digits (thousandth’s place) in the computation and then round to the nearest whole number.
Odds ratio = 13.97661/0.252111
Odds Ratio = 55.438
55.438
. Use the dataset “Dose response Fall 2021 Quiz” for this problem. A pre-clinical dose response study was conducted to understand the dose-response of a particular molecule. It is hypothesized that as the dose increases (over the range tested), the likelihood/probability of a positive response will increase. Approximately 12 mice were tested per dose and the outcome (positive/negative) was recorded. Conduct a logistic regression, using ln(dose), to assess the relationship between dose and outcome. Note: The following should happen automatically but, if not, you will need to use the “freq” option (use the variable ”count”).
What is the value for ln(dose) corresponding to a 50% probability of having a positive outcome (round to the nearest hundredth’s place)?
The probability of 0.5 corresponds to log odds of 0. Hence, the log(dose) would be -Intercept/Slope
Hence, dose for 0.5 probability of positive response is e^(-0.629749/0.965469)=0.520861
Required Dose level = 0.52
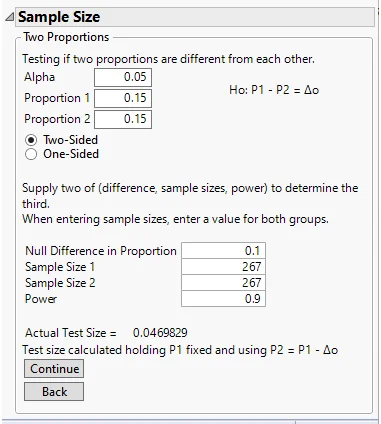
A researcher is designing a clinical trial to assess the efficacy of a new treatment versus placebo. However, they want to size it sufficiently to be able to assess the safety of a particular adverse event as well. It’s expected that approximately 5% of the women on placebo will experience the adverse event. The researcher wants to power the study at 90% to be able to detect an increase of 10% between the 2 groups (i.e. an incidence of 15% in the new treatment group). Using JMP, what sample size per treatment group is needed?
Using JMP, the sample size per treatment group is 267. Total sample size is 534.