Different Types of Crimes in Chicago
Word Document (with responses to the assignment questions).
1. Using the data file BUCJ59105ACHICAGO.SAV: You have been asked to develop a statistical profile of crime in the city in 2020 and answer the following questions. In your answer, use an appropriate tabular or graphic technique that displays the answer to others in an effective way:
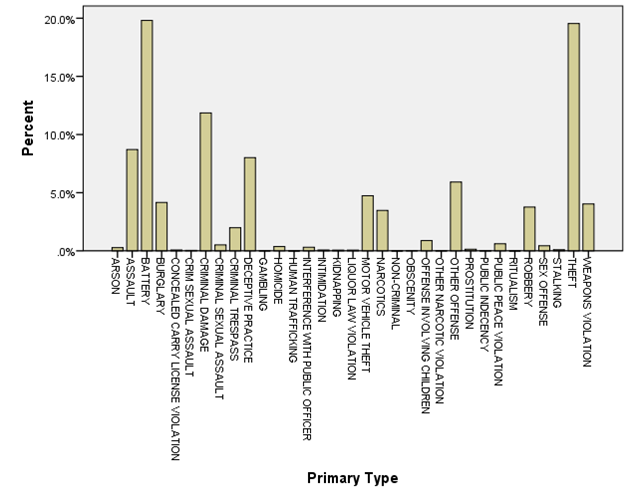
a. What were the three most frequent offenses occurring in the city in 2020?
It can be seen that Battery, Theft, and criminal damage are the three most frequent offenses occurring in the city in 2020.
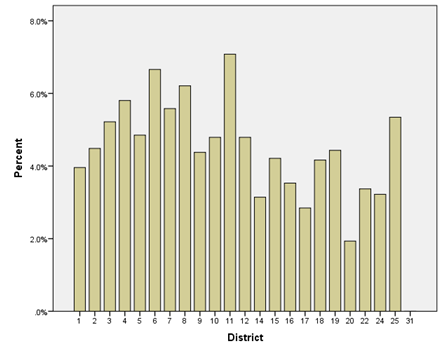
b. What were the three districts that had the highest number of crimes reported?
District numbers 11, 6, and 8 were the three districts that had the highest number of crimes reported.
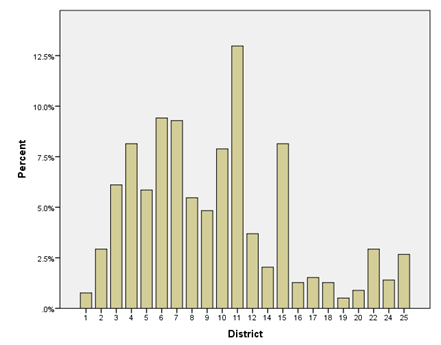
c. Homicide is a concern – what districts reported the most homicides in 2020?
Districts 11, 6, and 7 reported the top three homicides in %age in 2020.
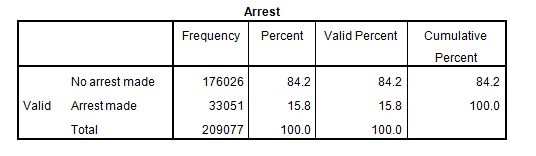
d. What percent of all crimes reported in 2020 were cleared by arrest?
15.8% of all crimes reported in 2020 were cleared by arrest
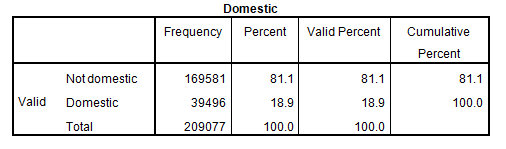
e. What percent of all crimes involved a domestic component?
18.9% of all crimes involved a domestic component.
2. Using the file BUCJ59105CCHICAGOCCAS.SAV
a. Compute two new variables:
i. BURGRATE
ii. MVTHEFTRATE
b. How many community areas are there in Chicago?
There are 77 community areas in Chicago.
Community Area
| Frequency | Percent | Valid Percent | Cumulative Percent | |
| 1-Rogers park | 1 | 1.3 | 1.3 | 1.3 |
| 2-West Ridge | 1 | 1.3 | 1.3 | 2.6 |
| 3-Uptown | 1 | 1.3 | 1.3 | 3.9 |
| 4-Lincoln Square | 1 | 1.3 | 1.3 | 5.2 |
| 5-North Center6.5 | 1 | 1.3 | 1.3 | 6.5 |
| 6-Lake View | 1 | 1.3 | 1.3 | 7.8 |
| 7-Lincoln Park | 1 | 1.3 | 1.3 | 9.1 |
| 8-Near North Side | 1 | 1.3 | 1.3 | 10.4 |
| 9-Edison Park | 1 | 1.3 | 1.3 | 11.7 |
| 10-Norwood Park | 1 | 1.3 | 1.3 | 13.0 |
| 11-Jefferson Park | 1 | 1.3 | 1.3 | 14.3 |
| 12-Forest Glen | 1 | 1.3 | 1.3 | 15.6 |
| 13-North Park | 1 | 1.3 | 1.3 | 16.9 |
| 14-Albany Park | 1 | 1.3 | 1.3 | 18.2 |
| 15-Portage Park | 1 | 1.3 | 1.3 | 19.5 |
| 16-Irving Park | 1 | 1.3 | 1.3 | 20.8 |
| 17-Dunning | 1 | 1.3 | 1.3 | 22.1 |
| 18-Montclare | 1 | 1.3 | 1.3 | 23.4 |
| 19-Belmont Cragin | 1 | 1.3 | 1.3 | 24.7 |
| 20-Hermosa | 1 | 1.3 | 1.3 | 26.0 |
| 21-Avondale | 1 | 1.3 | 1.3 | 27.3 |
| 22-Logan Square | 1 | 1.3 | 1.3 | 28.6 |
| 23-Humboldt Park | 1 | 1.3 | 1.3 | 29.9 |
| 24-West Town | 1 | 1.3 | 1.3 | 31.2 |
| 25-Austin | 1 | 1.3 | 1.3 | 32.5 |
| 26-West Garfield Park | 1 | 1.3 | 1.3 | 33.8 |
| 27-East Garfield Park | 1 | 1.3 | 1.3 | 35.1 |
| 28-Near West Side | 1 | 1.3 | 1.3 | 36.4 |
| 29-North Lawndale | 1 | 1.3 | 1.3 | 37.7 |
| 30-South Lawndale | 1 | 1.3 | 1.3 | 39.0 |
| 31-Lower West Side | 1 | 1.3 | 1.3 | 40.3 |
| 32-The Loop | 1 | 1.3 | 1.3 | 41.6 |
| 33-Near South Side | 1 | 1.3 | 1.3 | 42.9 |
| 34-Armour Square | 1 | 1.3 | 1.3 | 44.2 |
| 35-Douglas | 1 | 1.3 | 1.3 | 45.5 |
| 36-Oakland | 1 | 1.3 | 1.3 | 46.8 |
| 37-Fuller Park | 1 | 1.3 | 1.3 | 48.1 |
| 38-Grand Boulevard | 1 | 1.3 | 1.3 | 49.4 |
| 39-Kenwood | 1 | 1.3 | 1.3 | 50.6 |
| 40-Washington Park | 1 | 1.3 | 1.3 | 51.9 |
| 41-Hyde Park | 1 | 1.3 | 1.3 | 53.2 |
| 42-Woodlawn | 1 | 1.3 | 1.3 | 54.5 |
| 43-South Shore | 1 | 1.3 | 1.3 | 55.8 |
| 44-Chatham | 1 | 1.3 | 1.3 | 57.1 |
| 45-Avalon Park | 1 | 1.3 | 1.3 | 58.4 |
| 46-South Chicago | 1 | 1.3 | 1.3 | 59.7 |
| 47-Burnside | 1 | 1.3 | 1.3 | 61.0 |
| 48-Calumet Heights | 1 | 1.3 | 1.3 | 62.3 |
| 49-Roseland | 1 | 1.3 | 1.3 | 63.6 |
| 50-Pullman | 1 | 1.3 | 1.3 | 64.9 |
| 51-South Deering | 1 | 1.3 | 1.3 | 66.2 |
| 52-East Side | 1 | 1.3 | 1.3 | 67.5 |
| 53-West Pullman | 1 | 1.3 | 1.3 | 68.8 |
| 54-Riverdale | 1 | 1.3 | 1.3 | 70.1 |
| 55-Hegewisch | 1 | 1.3 | 1.3 | 71.4 |
| 56-Garfield Ridge | 1 | 1.3 | 1.3 | 72.7 |
| 57-Archer Heights | 1 | 1.3 | 1.3 | 74.0 |
| 58-Brighton Park | 1 | 1.3 | 1.3 | 75.3 |
| 59-McKinley Park | 1 | 1.3 | 1.3 | 76.6 |
| 60-Bridgeport | 1 | 1.3 | 1.3 | 77.9 |
| 61-New City | 1 | 1.3 | 1.3 | 79.2 |
| 62-West Elsdon | 1 | 1.3 | 1.3 | 80.5 |
| 63-Gage Park | 1 | 1.3 | 1.3 | 81.8 |
| 64-Clearing | 1 | 1.3 | 1.3 | 83.1 |
| 65-West Lawn | 1 | 1.3 | 1.3 | 84.4 |
| 66-Chicago Lawn | 1 | 1.3 | 1.3 | 85.7 |
| 67-West Englewood | 1 | 1.3 | 1.3 | 87.0 |
| 68-Englewood | 1 | 1.3 | 1.3 | 88.3 |
| 69-Greater Grand Crossing | 1 | 1.3 | 1.3 | 89.6 |
| 70-Ashburn | 1 | 1.3 | 1.3 | 90.9 |
| 71-Auburn Gresham | 1 | 1.3 | 1.3 | 92.2 |
| 72-Beverly | 1 | 1.3 | 1.3 | 93.5 |
| 73-Washington Heights | 1 | 1.3 | 1.3 | 94.8 |
| 74-Mount Greenwood | 1 | 1.3 | 1.3 | 96.1 |
| 75-Morgan Park | 1 | 1.3 | 1.3 | 97.4 |
| 76-O'Hare | 1 | 1.3 | 1.3 | 98.7 |
| 77-Edgewater | 1 | 1.3 | 1.3 | 100 |
| Total | 77 | 100.0 | 100.0 |
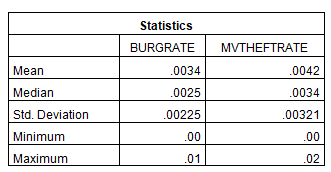
c. For each of these variables, what is the minimum rate? The maximum rate? The median rate? The mean rate? The standard deviation?
These values for the two variables are presented in the table below:
d. What variables for the neighborhood would you want to consider looking at to explore these differences?
Unemployment rates, median income rate, ethnicity variables (white, Hispanic, black, Asian, others), education (less than High school, High school, some college, associate, Bachelor’s and graduate), median age are the variables for the neighborhood that could be considered to explore these differences.
3. Analysis of Variance. Using the file BUCJ59105CCHICAGOCCAS.SAV, look at the relationship between unemployment rates and burglary rates using an analysis of variance model. The variable UNEMPGROUP assigns neighborhoods to one of three groups: low unemployment rate (under 6.5%); moderate unemployment rate (6.5% up to 13.8%); and high unemployment (13.8% or higher). This variable creates three equal groups of 25 neighborhoods each. The two neighborhoods with the highest unemployment rates were not assigned to a group.
a. Consider the relationship between unemployment rates in the neighborhood and burglary rates. Perform a one-way analysis of variance
Post Hoc Tests
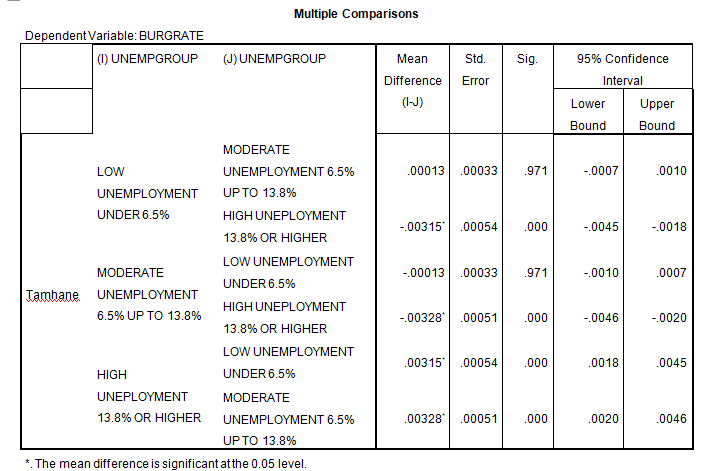
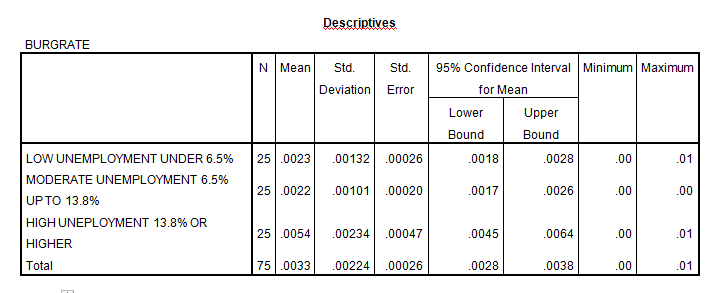
b. What are the mean burglary rates for each of the three groups?
Mean burglary rates for
Low unemployment (under 6.5%) - 0.0023
Moderate unemployment (6.5% upto 13.8%) - 0.0022
High unemployment (13.8% or higher) - 0.0054
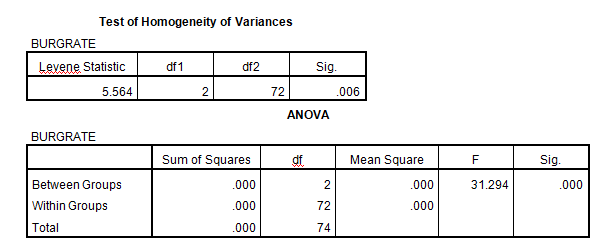
c. Is there a significant difference between the groups? What statistic did you use to make this conclusion
The p-value of the F-stat is close to zero. Since the p-value is less than 0.05 at the 5% alpha level, the results conclude that there is a significant difference between the groups.
F-test is used to make this conclusion.
d. Which groups are different from each other? Are any groups not statistically significantly different?
There is a significant difference between the following groups:
- Low unemployment and high unemployment
- Moderate unemployment & High unemployment
There is no significant difference between the following groups:
- Low unemployment and moderate unemployment
e. Based on the results of your analysis, what policies would you recommend to city leadership to reduce burglary rates in the city? Can you relate your findings to a theory from criminology?
We recommend that city leadership might try to provide employment options to the unemployed. Increasing the cost of crime can also help reduce such criminal activities. The rational choice theory of criminology suggests that people make rational choices and they will be willing to commit a crime if it helps serve their interest. The income of the unemployed youth is lower and they have the option of using illegal or criminal activities for monetary gains.
4. Linear regression. Using the file BUCJ59105CCHICAGOCCAS.SAV, Consider the relationship between motor vehicle theft rates and median income rates in the neighborhoods. You will use your own variable MVTHEFTRATE along with MEDIC.
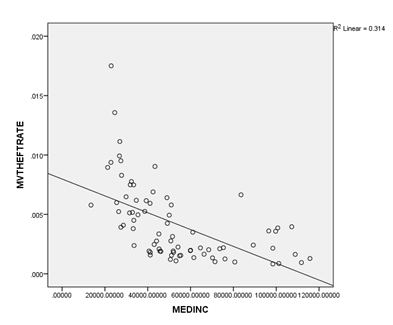
The trend line is downward sloping which means that neighborhoods with higher incomes are less likely to report a motor vehicle theft.
b. Write an equation for the regression model.
MVTHEFTRATE = 0.008 – 7.087E-008*MEDINC
c. Are the results statistically significant?
The p-value of t-stat and F-stat is close to zero which means that the results are statistically significant.
d. What does the R2 tell us? Why is it important?
The value of R2 at 0.314 tells that about 31.4% of the variation in MVTHEFTRATE can be explained by Medinc. It tells us about the goodness of fit of the model.
e. In a few sentences, interpret the results of your analysis. What policies would you recommend to city leadership to reduce motor vehicle theft in the city? Can you relate your findings to a theory from criminology?
The significant results conclude that neighborhoods with higher incomes are less likely to report a motor vehicle theft and vice versa. Moreover, about 31.4% of the variation in motor vehicle theft can be explained by the income variable.
Apart from increasing the opportunities for generating higher income for the population, we recommend creating policies and infrastructure for increased perception of the risk for the offenders which may help reduce motor vehicle theft in the city. These can be done using modern technologies like vehicle tracking, using GPS, number plate reading, and increased penalties and fines.
Many studies do suggest that motor vehicle theft crimes support rational choice theory and strain theory among others. Motor vehicle theft is done for different reasons like for monetary gains, usually, by older adults (rational choice theory), and for peer pressure usually by young adults (strain theory).