Population Proportion and Best Point Estimate
1) (8 Points) Mrs. Jones is considering running for mayor of her city. Before completingthe petition, she decides to conduct a survey of registered voters in the city. A sample of 400 voters reveals that 144 would not support her in the upcoming election. Let success denote observing a randomly selected registered voter in her city supporting Mrs. Jones in the upcoming election.
a. Define the population proportion of success for this question. What is its symbol?
b. What is the best point estimate of the population proportion of success?
c. Develop a 97% confidence interval for the population proportion of success.
d. Interpret your result
Answer 1:
a) Population proportion of success is selecting a registered voter in her city supporting Mrs Jones in the upcoming election and its symbol is mu.
b) The best point estimate is sample proportion= 400-144/400=256/400=0.64
c) CI = p+/- zcsqrt(pq/n)
Z critical at 97% is 2.17
Thus, CI = 0.64+/- 2.17*sqrt(0.64*0.36/400)
= 0.64+/- 0.05208 = 0.588,0.692
d) Thus, we are 95% confident that the population proportion of selecting a registered voter will lie between 58.8% and 69.2%.
Confidence Level and Significant Difference
e) (12 Points) A financial analyst wants to compare the mean turnover shares oftechnology stocks versus oil stocks. A random sample of 16 technology stocks revealed the sample mean turnover is 5 shares and sample standard deviation is 3. A random sample of 16 oil stocks revealed the sample mean turnover is 7 and sample standard deviation is 4.
a. At the 92.5% level of confidence, is there a significant difference in the turnover shares of the two types of stocks? Clearly show the five steps of hypothesis testing.
b. What assumptions do we need to make to conduct this test of hypothesis?
c. What is the significance level?
d. Calculate and interpret the p-value
Answer 2:
Mean = 5, sd=3, for tech stocks
Mean =7, sd=4, fr oil stocks
a) Five step procedure is as follows:
Null hypothesis states that there is no difference in the mean turnover shares of the two types of stocks
Alternative hypothesis states that there is a difference in the mean turnover shares of the two types of stocks
7.5% alpha level is chosen.
Decision criteria states that if the t-computed value of t-test is more than 1.8445 or less than -1.8445, we reject the null hypothesis else we cannot reject the null hypothesis.
T= (5-7)/sqrt[(15*3*3+15*4*4/30) (2/16)]
= -2/sqrt[((135+240)/30)*0.125]
=-2/sqrt(1.5625) = -2/1.25 = -1.6
Since the t-computed is more negative than t-critical, we reject the null hypothesis and conclude that there is a difference in the turnover shares of the two types of stocks.
b) The requirements are:
Data values must be independent;
Data values are normally distributed;
Data values are continuous.
c) The significance level is 7.5%
d) The p-value for the test is 0.12. This means that p-value is more than alpha level and thus, we cannot reject the null hypothesis and conclude that there is no difference in the turnover shares of the two types of stocks.
Random Sampling Experiment
e) (12 Points) Pizza Delight advertises that at least 90 percent of its orders are deliveredwithin 25 minutes of the time the order is placed. A random sample of 100 orders revealed that 81 were delivered within the advertised time.
a. At significance level 0.01 , does the evidence suggest that at least 90 percent of the orders are delivered within the promised time? Clearly show five steps of hypothesis testing.
b. What are the requirements of this test? Are they met? Explain
c. What is the confidence level?
d. Calculate and interpret value of and show it graphically if the true proportion of deliveries within 25 minutes is 80%
Answer 3:
a) Five step procedure is as follows:
Null hypothesis states that less than or equal to 90% are delivered within 25 minutes.
Alternative hypothesis states that more than 90% are delivered within 25 minutes
1% alpha level is chosen.
Decision criteria states that if the p-value is less than 0.01, we reject the null hypothesis else we cannot reject the null hypothesis.
Z=0.81-0.9/sqrt(0.9*0.1/100) =-0.09/0.03 =-3
And the p-value is 0.0013
Since the p-value is less than 0.01, we reject the null hypothesis and conclude that more than 90% are delivered with in 25 minutes.
b) The value of n*p = 0.81*100 = 81 and npq=81*0.19 = 15.39 should be more than 5
And they have been met by the data.
c) CI = CI = p+/- zcsqrt(pq/n) =0.81+/- 2.576*0.03 = 0.733, 0.887
d)
Regression Analysis
Answer 4:
A) Table
| x | y | |||||
| 2 | 22 | -6 | 36 | -18 | 324 | 108 |
| 4 | 30 | -4 | 16 | -10 | 100 | 40 |
| 6 | 32 | -2 | 4 | -8 | 64 | 16 |
| 8 | 40 | 0 | 0 | 0 | 0 | 0 |
| 10 | 44 | 2 | 4 | 4 | 16 | 8 |
| 12 | 54 | 4 | 16 | 14 | 196 | 56 |
| 14 | 58 | 6 | 36 | 18 | 324 | 108 |
| 56 | 280 | 0 | 112 | 0 | 1024 | 336 |
Regression: y = bx+a
b = 〖SS〗_xy/〖SS〗_x a =Y ̅-bX ̅
〖SS〗_xy= ∑▒〖XY- (∑▒X ∑▒Y)/N〗
SSx = ∑▒(X-X ̅ )^2
Ssxy= 2576-(56*280/7)=336
Ssx = 112
B = 336/112=3
A=40-3*8 = 40-24 =16
Y = 16+3*x
b) the scatter plot is:
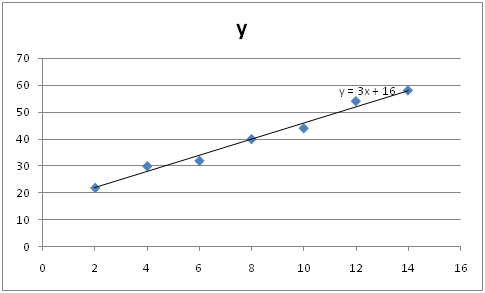
c) The value of slope at 3 suggests that increase in price by 1 dollars results in about 3000 higher demand and vice versa.
d) Y = 16+3*x
Y = 16+3*18 = 16+54 = 70