Problem Description:
The task for the SAS Assignment was to create a predictive analysis project in SAS Miner, starting from the very beginning, including project creation, diagram development, library setup, data source definition, and data exploration through the creation of a histogram. This assignment provides a step-by-step solution to guide users through these essential stages in SAS Miner.
Solution
Creation of a project
After the successful loading of the SAS miner, a project was created following the steps provided in the PowerPoint slides. The project was named “My project”. The figure is shown below;
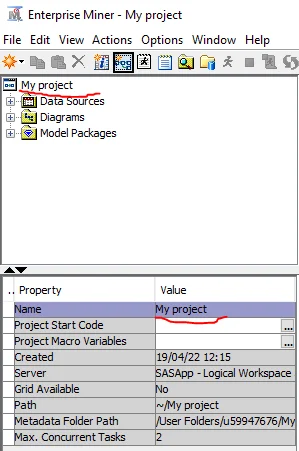
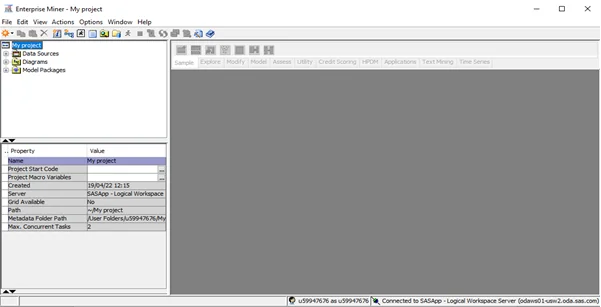
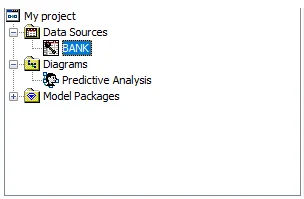
The figure above shows a successful creation of a project in SAS Miner while the figure below shows the project in the Miner environment.
Creating SAS Miner Diagram
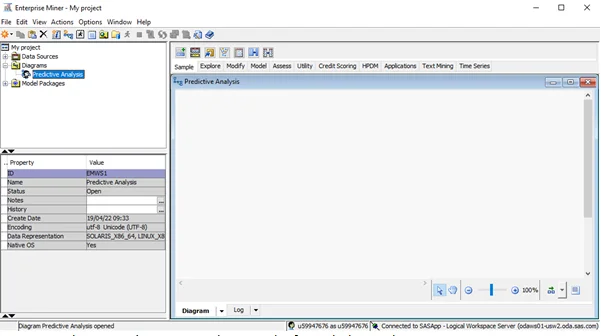
After creating the project, a Miner diagram named “Predictive Analysis” was created within the SAS environment. The Miner diagram is shown in the figure below in the SAS miner environment.
Creating a Miner Library
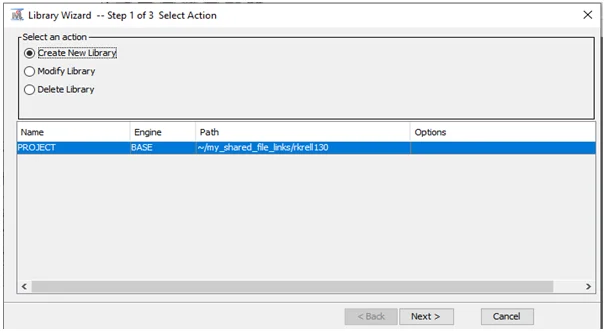
While creating a Library within the project, the recommended file path ~/my_shared_file_links/rkrell130 was looked into keenly as per the recommended instructions, the figure below shows the creation of a library using the library wizard in the Miner environment.
Defining a Data Source
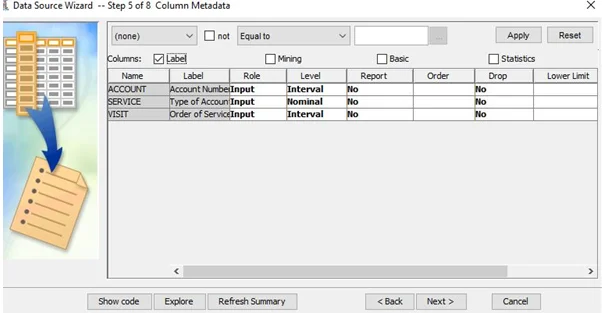
In creating a project, defining a data source is the most vital step. The data BANK was defined successfully within the created project. The data had 3 variables namely – Account which is the account number, Service which is the type of account, and Visit which is the order of service. Account and visit were of interval level while service was of nominal level. The diagrams below show a full illustration.
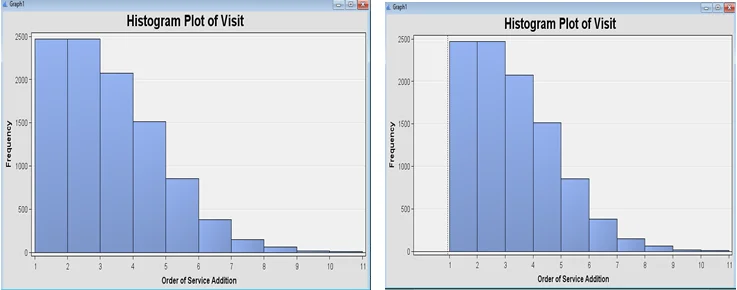
The figure above shows a histogram plot of the order of service addition. On the right, we have the plot inclusive of the missing bin. From the histogram plot, we can see the distribution is not normal, it is a left-skewed distribution.
.webp)