Assignment instructions
PART 1: EXAMINE RELATIONSHIPS BETWEEN HEALTH CARE UTILIZATION & HEALTH
1. Use the Polit2SetB dataset to answer the following research question:
Are there relationships between health care utilization (# OF VISITS TO MD IN PAST 12 MONTHS), weight (BODY MASS INDEX), physical health (SF-12 PHYSICAL HEALTH SCORE) and mental health (SF-12 MENTAL HEALTH SCORE) among low-income women?
2 In the dataset, identify the four variables that you will need to answer the question. Look carefully at the variable names and variable labels to select the correct variables. Refer to the codebook (Canvas, under Class databases) for details about the variables and their characteristics as needed.
3 Note: The SF-12 is a brief, widely used measure of health status based on participants’ self-report. For both the SF-12 physical health and SF-12 mental health subscales, higher scores represent better health.
4 Run a correlation analysis to examine the relationship between these 4 variables. Put all 4 variables into the analysis at the same time. Then, answer the following questions.
| QUESTION | ANSWER: FILL IN THE BLANKS |
| 1a. Which two variables have the strongest correlation in the matrix? Interpret this correlation. | There is a (statistically significant/not statistically significant) correlation between docvisit and bmi (r= -0.316). Higher values of docvisitis correlated with (lower) scores on bmi. |
| 2a. Which two variables have the weakest correlation in the matrix? Interpret this correlation. | There is a (statistically significant/not statistically significant) correlation between bmi and sf12ment (r= -0.078). Higher values of bmiis correlated with lower scores on sf12ment. |
PART 2: ANALYZE RELATIONSHIPS BETWEEN EMPLOYMENT STATUS, HEALTH-RELATED CHARACTERISTICS, AND HEALTH
1. Use the Polit2SetB database to answer the following research question:
In this sample of low-income women, are there relationships between women’s current employment status [WORKNOW] and their health-related characteristics, such as having no health insurance [NOINSUR], health condition limits ability to work [HLTHLIMIT], and self-report of being in fair or poor health [HEALTH]?
2. Examine the level of measurement for these variables. Run the appropriate statistical test to examine the relationships between these variables. Put all four variables into the analysis at the same time. Identify the statistics from your SPSS output that are needed to complete the following table.
3. Fill in Table 2 on this worksheet (type in the blank numbers in the body of the table) with the results. Then summarize and interpret the results by filling in the blanks in the paragraph template below.
4. Tips:
a. n (%) indicates that you need to provide numbers and percentages, not just percentages.
b. Correctly choose the row percentage or the column percentage to complete this table. The question that you are answering is this: How many and what percent of non-working women and of working women had the health-related characteristics listed in the left column?
Table 2. Relationship between Women’s Employment Status and Health Characteristics (N=1,000 a)
| Total Number of Women | Current Employment Status | Current Employment Status | |
Health-related Characteristic | n (%) | Non-working
n (%) | Working
n (%) |
| Having no health insurance | 178 (17.9) | 17 (14.2%) | 101 (22.4%) |
| Health condition limits ability to work | 312 (31.3) | 231 (42.4%) | 81 (17.9%) |
| Fair or poor health | 286 (29.8) | 191 (36.3%) | 95 (21.9%) |
| Women who worked outside the home reported fewer health problems than those who were not employed. Non-working women were more than 2.85 times as likely as employed women to say they had a health condition that limited their ability to work, 42.4%and17.9%, respectively. Non-working women were more likely to report their health as fair/poor than working women 36.3% and 21.9%, respectively. Non-working women were, however, less likely to say they had no health insurance14.2%than employed women 22.4%, perhaps reflecting the fact that women who worked outside the home are not less concerned about health insurance. |
PART 3: GENERATE CROSS-TABULATION AND CALCULATE RISK INDICES IN SPSS
- Use the Polit2SetB database to answer the following research question:In a sample of low-income women, does age at first birth increase the risk of being in poverty?
- Use the following variables: poverty (categorical variable: 1= below the poverty line, 2= above poverty line) age1bir (continuous variable: age at first birth, in years).
- In order to compute the crosstabulation table and risk indices, both variables must be categorical. Recode the age1bir to convert it to a categorical variable with the correct 0-1 codes. Create a new variable called age1bir_rec.
- Use SPSS to create a 2 X 2 crosstabs table to evaluate this relationship. Be sure to set up the crosstabs correctly. Poverty is the outcome variable – being below the poverty line is the negative outcome. Age at first birth (age1bir_rec) is the risk exposure variable – giving birth before age 18 is the “at risk/exposed to risk” categoryANSWER THE FOLLOWING QUESTIONS.WHERE APPROPRIATE, ROUND YOUR ANSWERS TO 2 DECIMAL PLACES.
| QUESTION | ANSWER |
| 3a. What is the absolute risk of living below poverty level for women who gave birth before age 18? | 0.75
|
| 3b. What is the absolute risk of living below poverty level for women who gave birth when they were 18 years of age or older? | 0.75
|
| 3c. What is the relative risk (RR) of being in poverty for women who gave birth < 18 years versus > 18 years? | 1 |
| 3d. Write one sentence to interpret the RR of being in poverty in this sample. | This indicates that risk of being in poverty is equal for women who gave birth before age 18 versus 18 years of age or older. |
| QUESTION | ANSWER |
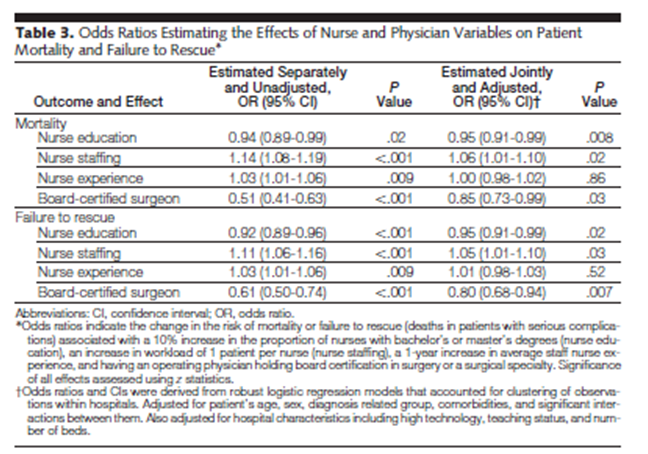
| 4a. Which odds ratio(s) for the effects of nurse and physician variables on failure to rescue were not statistically significant (assuming statistical significance when p < .05)? | Nurse experience |
| 4b. Interpret the odds ratio for the relationship between having a board-certified surgeon on staff on failure to rescue, using the provided template. | Having a board-certified surgeon on staff reduced the odds of failure to rescue by 80%. For 95% of samples, having a board-certified surgeon will be associated with lower odds of failure to rescue by 0.68 – 0.94. This means a32% reduction in odds of death at best, and a6% reduction in odds of failure to rescue at worst. |