ANOVA Test and medical television show Assignments
Part One: Answer the following questions.
1. If you have a 3 x 5 x 2 ANOVA
- How many factors are there?
- How many levels are there of the second factor?
- How many groups of participants would you have?
2. You conduct a study examining the impact of weather on students’ attendance. You follow the same group of students enrolled in a chemistry class and track their attendance over the course of the spring semester. You compare the average number of missed classes during February, March, April, and May to see whether there are significant differences in rates of attendance. What analysis would you run and why? Your options are paired samples t-test, one-way ANOVA, repeated measures ANOVA (RANOVA), and two-way ANOVA. When explaining why you must include an explanation that is specific to the selected test (e.g., because there are groups that is not specific).
3. You conduct a follow-up study to see whether there are significant differences in rates of attendance based on where students live. In this study, you get a random sample of students living in dormitories, a sample of students living in on-campus apartments, and a final sample of students living off-campus and compare their total number of missed classes in the Spring 2021 semester. What analysis would you run and why? Your options are paired samples t-test, one-way ANOVA, repeated measures ANOVA(RANOVA), and two-way ANOVA. When explaining why you must include an explanation that is specific to the selected test (e.g., because there are groups that is not specific).
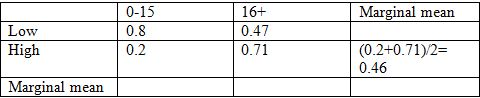
4. Below is a table for the results of a hypothetical study examining the impact the number of selfies individuals have on their social media pages and their degree of empathy on how narcissistic they are. Narcissism was measured on a scale of 0 – 10, with higher values representing higher degrees of narcissism. Use the table to answer questions 4a – 4d.
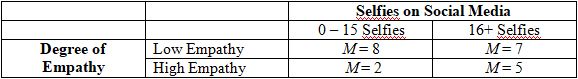
- What was the average level of narcissism for participants with:
- High degrees of empathy and 0 – 15 selfies on their social media page?
- Low degrees of empathy and 16+ selfies on their social media page?
b. Calculate the marginal means for each factor and grand mean using hand calculations. For full credit, you must label which marginal means correspond with a given factor and its levels.
c. Do you have a possible main effect on the degree of empathy and selfies on social media? For full credit, you must explain your reasoning for each factor and address each factor in your answer.
d. Do you have a possible interaction? Complete the necessary calculations (hand calculations) and explain how you came to this conclusion.
Part Two. Hand calculations. For these questions, you must show all of your work including the formulas used to calculate the responses. Provide your responses/round your work to the hundredth place.
5. You conduct a study examining the impact of exposure to fictional medical television shows on people’s anxiety regarding their own physical health. You get a sample of 120 middle-aged adults and have them watch either one episode of a medical television show, two episodes of a medical television show, or three episodes of a medical television show. You then have the participants rate how anxious they are about their physical health on a scale of 1 (Not at all) to 10 (Extreme Anxiety) to see whether there are significant differences in participants’ health-related anxiety. The data for your hypothetical study is presented below: The information regarding the sample sum of squares, including the one that you will need to calculate, is provided in 4a.
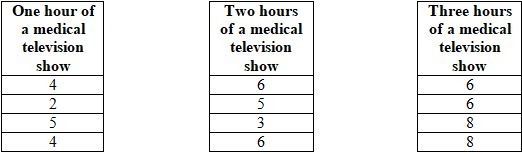
a. The sum of squares for those who watched one hour of a medical television show is 2; the sum of squares for those who watched two hours of a medical television show is 6. You will need to calculate the sum of squares for the group who watched three hours of a medical television show and must show your work, including the formula used.
b. Calculate the following for this example: N, G, EX2 for all participants; and k. In your response, you must show the values used to obtain the answers (e.g., you can’t just write N = 1 but must show what values you used to get the answer for N).
c. Calculate the necessary degrees of freedom for this study. In your response, you must show the formulas used to obtain each degree of freedom.
d. For this analysis, you are using an alpha level of .05. What is the critical value that you will be using for this calculation? How did you determine this?
e. Complete the remaining calculations necessary to get the obtained value for this analysis. You must show all the formulas used, including all of the steps taken to get the final response.
f. Calculate the effect size for this problem. You must show the formula used and the steps are taken to get the final answer.
g. If you were running this analysis on SPSS, would you conduct a posthoc analysis? Why or why not?
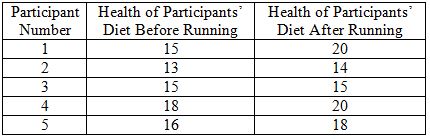
6. A researcher conducts a study to examine the impact of running on one’s overall diet. The researcher obtains a random sample of 5 young adults and has them fill out a series of questionnaires to determine how healthy their diet is on a scale of 0 (Very Unhealthy) to 20 (Very Healthy). After getting this information, the researcher has all the participants run for a total of four hours weekly for six months. After the six-month period has ended, the researcher has the same participants complete the same series of questionnaires to determine whether the healthiness of their diet is significantly different than before they started running. Below is the data for your hypothetical study:
a. For this example, you are using an alpha level of .05. What is the critical value that you will be using for this calculation? How did you determine this?
b. Complete all the calculations necessary to get the obtained value for this analysis. You must show all the formulas used, including all of the steps taken to get the final response.
c. Compute the effect size for this example. For full credit, you must show all of the work including the formula used.
d. Compute the confidence interval for this example. For full credit, you must show all of the work, including the formula used.
e. Provide a summary of all of the results in APA format, including the answers from b through d and the appropriate means and standard deviations. The standard deviation for the health of diet before running is 2.79 and the standard deviation for diet after running is 1.82. For full credit, this answer must be typed. Responses that are handwritten will receive an automatic reduction given that the APA formatting cannot be fully assessed.
Part Three: Use the outputs provided as a separate attachment to provide answer the questions below. For all of these examples, you are using an alpha level of .05 to determine significance. Report all the results to the hundredth place.
Output #1. This output relates to a hypothetical study examining the impact of pet ownership and the number of children in a household on fathers’ levels of happiness. Happiness was measured on a scale of 0 – 10, with higher values indicating greater degrees of happiness.
1. Use the prompt, and output#1 to answer the following questions:
- How many factors are there in this study, and what are they?
- What are the levels of each factor?
2. What would the null and alternate hypothesis be for this example? Provide both using symbols
3. According to the results of Levene’s Test of Equality of Error Variances on Output #1, is it appropriate to conduct this ANOVA? How did you determine this?.
4. Provide a summary of the results from Output #1 in APA format, including the statistical information for the significant ANOVA(s) and corresponding effect size. For this response, you only need to provide the statistical information and summary of results for the significant results, related effect size, and relevant means and standard deviations. For full credit, this answer must be typed. Responses that are handwritten will receive an automatic reduction given that the APA formatting cannot be fully assessed.
Output #2. Imagine that the researcher decides to conduct the same study examining the impact of pet ownership and the number of children in a household on a mother’s level of happiness using the same 10 point scale described above. Use Output #2 to answer the following questions.
1. Does the line graph in Output #2 suggests that there is a significant interaction? Why or why not?
Output #3. This output relates to a hypothetical study examining the impact of length of time spent in a nursing home on cognitive functioning. In the study, you recruit a group of 30 individuals when they are admitted to a nursing home and track their cognitive decline over the period of one year. You assess their cognitive functioning on a scale of 0 – 15, with higher scores indicating greater cognitive deficits, and measure their cognitive functioning at the time of admission, six months after admission, and one year after admission to see if there is a significant difference.
1. According to the results of Mauchly’s Test of Sphericity in Output #3, what line should be used to interpret the results of the RANOVA? Explain how you determined this.
2. Provide a summary of the results in APA format from Output #3, including the statistical information for the F-ratio, effect size, and description of the post-hoc analyses, including the means and standard deviations for the appropriate groups. For full credit, this answer must be typed. Responses that are handwritten will receive an automatic reduction given that the APA formatting cannot be fully assessed.
Part 4: This part is optional, and students can receive up to four points of extra credit. To be able to answer the questions, students will need to refer to the output provided on Sakai titled “Extra Credit Output.”
The output corresponds to a hypothetical study examining whether the way in which information is presented impacts the number of accurate details participants are able to recall. In the study, participants are placed into one of three groups and then presented with a story in either a written format, or video format, or both in a written and video format. Afterward, participants are asked to recall the number of details that they remember from the story and the researcher records the number of accurate details recalled (up to 30) to determine whether the number of accurate details differs across the various ways that the information was presented. Use the output provided on Sakai titled “Extra Credit Output” to answer the following questions. For this example, you are using an alpha level of .05 and should report/round the results to the hundredth place.
1. What type of ANOVA did the researcher run in this example? For this answer, your options are one-way ANOVA, RANOVA, or two-way ANOVA. Why was this the appropriate test to use?
2. Provide the null and alternate hypothesis for this study using symbols.
Provide a summary of the results in APA format using the “Extra Credit Output,” including the statistical information for the F-ratio, effect size, and description of the post-hoc analyses, including the means and standard deviations for the appropriate groups. For full credit, this answer must be typed. Responses that are handwritten will receive an automatic reduction given that the APA formatting cannot be fully assessed.
Solution:
Question 1
a). There are three factors
b). the second factor has 5 levels.
c). There would be three groups of participants
Question 2
Repeated measure ANOVA would be used because the average number of missed classes were repeated overtime (during February, March, April, and May)
Question 3
One-way ANOVA because the objective was to examine whether there is a difference between the total number of missed classes in the Spring 2021 semester for students living in dormitories, students living in on-campus apartments, and students living off-campus.
Question 4
a). High degrees of empathy and 0 – 15 selfies on their social media page
2/10=0.20
b). Low degrees of empathy and 16+ selfies on their social media page
7/12=0.58

c). for Low esteem. the marginal means is
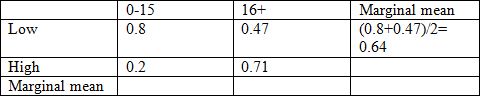
For High esteem, the marginal means is
For 0-15 selfies, marginal means is
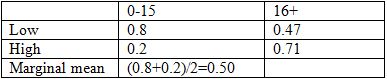
For 16+ selfies, marginal means is
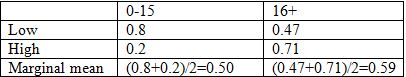
grand mean = (22/2) = 11
Question 5
a). Using sum of squares = ∑▒〖(y_i-y ̅ )^2,〗
sum of squares = 46.25/4=11.56
b).
∑▒x=11+14+20=63
∑▒x^2 =4^2+2^2+5^2+⋯+8^2
=16+2+25+6+5+3+6+⋯+〖80〗^2=367
N=4+4+4=12
c). degree of freedom for factor is k-1, and this is 3-1=2
the total degree of freedom is N-K-1 and this is 12--1=11
d). Critical value is computed as, F(〖df〗_(1,) 〖df〗_2 )α=F(2,9),0.05=4.26
e).
4 6 6
2 5 6
5 3 8
4 6 8
15 20 28
〖SS〗_B=((t_1^2)/n_1 +(t_2^2)/n_2 +(t_3^2)/n_3 )-(∑▒x^2 )/N
〖SS〗_B=(〖15〗^2/4+〖20〗^2/4+〖28〗^2/4)-〖63〗^2/4=352.25-330.75=21.5
〖SS〗_W=∑▒x^2 -((t_1^2)/n_1 +(t_2^2)/n_2 +(t_3^2)/n_3 )
=367-352.25=14.75
ANOVA table
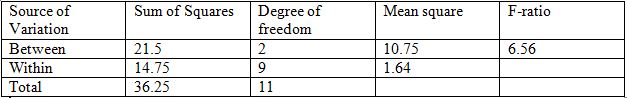
f). effect size is given as
d=(F×〖df〗_(1,))/(F×〖df〗_(1,)+〖df〗_(2,) )
=(4.26×2)/(4.26×2+9)=0.18
g). Yes, I would conduct a posthoc analysis because the tabulated F- value is greater than the tabulated F-value and this implies a significant difference in the different hours patient watches medical television shows.
Question 6
a). because the sample size is less than 30, we use the t-test with n-1 degrees of freedom, therefore for the critical value, we tabulate, t~α,n-1. Hence, the critical value is,
t_0.025,4=2.776
b). Test of Hypothesis
H_0:μ_d=0
H_1:μ_d≠0
α=0.05
Test statistic
t=(d ̅-μ_d)/(s_d ̅ ⁄√n) ~t_((n-1)) α⁄2
where
d=(∑▒d_i )/n and s_d ̅ =√(∑▒d^2 -〖(∑▒〖d)〗〗^2⁄n)/(n-1)
Decision rule: reject H_0if t_cal>t_tab accept otherwise
Calculations
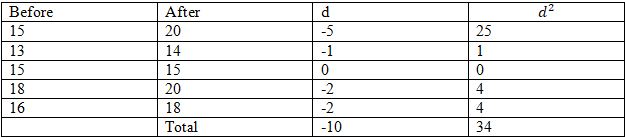
d=10/5=2 and s_d ̅ =√((34-〖(-10)〗^2⁄5)/(5-1))=1.8708
∴ t=(2-0)/(1.8708⁄√5)=2.39and t_((n-1)) α⁄2=t_4 0.025=2.776
c) effect size is given below as
d=t^2/(t^2+(n_1+n_2-2) )=〖2.39〗^2/(〖2.39〗^2+(5+5-2) )=0.42
d). confidence interval is given below as
C.I=d ̅±t×s_d ̅
∴C.I= -10±(2.39×1.87)
=[-14.47,-5.53]
e). There was a no significant difference in the mean scores of participant before (M=15.40, SD=1.82) and after running (M=17.4, SD=2.79) conditions; t(4)= 2.39, p = 0.05. The 95% confidence interval value, 95%[-14.47,-5.53], show that the true difference is within the interval -14.47 and -5.53.
Part Three
Output 1
1a). There are 3 factors namely; Pet ownership, Number of children, and father’s level of happiness
b). There are two levels for each factor.
2). Test of hypothesis for main effect Pet Ownership
H_0:α_1-α_2=0_2
H_1:α_1-α_2≠0
Test of hypothesis for main effect Number of children
H_0:β_1-β_2=0_2
H_1:β_1-β_2≠0
Test of hypothesis for interaction
H_0:〖αβ〗_1-α_β2=0_2
H_1:〖αβ〗_1-α_2 β≠0
3). Yes, it is appropriate to conduct the ANOVA test since the p-values in the levene’s test of equality of error variance table are all greater than the 0.05 level of significance.
4). Fathers’ happiness was analyzed with a 2 (Pet Ownership: 1 versus 2 ) and 2(Number of children: 0-2 children versus 3 or more) between-subjects ANOVA. The main effect of Pet ownership (M=, SD = ) was significant [F(1,36)=33.715,p<0.01,n_p^2=.484]. The main effect of number fo children[M=,SD=] was significant [F(1,36)=.040,p<0.01,n_p^2=.4001]. These main effects were qualified by a non-significant interaction between pet ownership and number of children.
Output 2
1. the line graph in Output #2suggest that there is no significant interaction because there was no intersection between the plots of the two independent factors.
Output 3
Since the p-value results of Mauchly’s Test of Sphericity is significant, this implies that a modification of the F-value statistics need to be done and this means using the Tests of Between-Subjects Effects.
A one-way between-subjects ANOVA was conducted to examining the impact of length of time spent in a nursing home on cognitive functioning, at admission[M = 4.03, SD= 1.79], six months after admission [M = 5.50, SD = 2.05] and one year after admission [M = 5.43, SD= 2.06],. There was a significant effect of length of time spent in a nursing home on cognitive functioning at the p<.05 level for the three conditions [F(1,29)=396.93,p<0.01,n_p^2=.932]
Bonus
1. One-way ANOVA
2. H_0:μ_1-μ_2=μ_3 versus H_1:μ_1≠μ_2≠μ_3
3. A one-way between-subjects ANOVA was conducted t compare the effect of information dissemination on accurate recall in written format [M = 11.40, SD= 4.72], video format [M = 11.60, SD = 7.82] or a combination of both formats [M = 21.40, SD= 2.72],. There was a significant effect of method of information on the number of accurate details participants recalled at the p<.05 level for the three conditions [F(2,27)=10.80,p<0.01]
Post hoc comparisons using the Tukey HSD test indicated that the mean score for written format [M = 11.40, SD= 4.72], was significantly different than the combination of both formats [M = 21.40, SD= 2.72].