Getting the hypothesis and interpreting the results
Here we state both the null and alternative hypotheses. When will then get the means and standard deviation of the work category and age category?
Research Questions
Is there a significant difference among corporate, CA, DC, and remote on satisfaction with org culture?
Is there a significant difference among corporate, CA, DC, and remote on satisfaction with the workload?
Is there a significant difference among corporate, CA, DC, and remote on satisfaction with IT?
Is there a significant difference among corporate, CA, DC, and remote on satisfaction with company’s benefits?
Is there a significant difference among corporate, CA, DC, and remote on satisfaction with current salary?
Select either age category or work location to examine group differences on each of the five satisfaction variables.
State each of the five research questions and the associated null and alternative hypotheses.
Solution 1
Null hypothesis:
There is no significant difference in satisfaction with org culture between work location groups (corporate, CA, DC, and remote)
Ho: μ_1=μ_2=μ_3=μ_4=μ_5
Alternative hypothesis
There is a significant difference in satisfaction with org culture between work location groups (corporate, CA, DC, and remote)
Ha: μ_1≠μ_2≠μ_3≠μ_4≠μ_5
Solution 2
Null hypothesis:
There is no significant difference in satisfaction with workload between work location groups (corporate, CA, DC, and remote)
Ho: μ_1=μ_2=μ_3=μ_4=μ_5
Alternative hypothesis
There is a significant difference in satisfaction with workload between work location groups (corporate, CA, DC, and remote)
Ha: μ_1≠μ_2≠μ_3≠μ_4≠μ_5
Solution 3
Null hypothesis:
There is no significant difference in satisfaction with IT benefit between work location groups (corporate, CA, DC, and remote)
Ho: μ_1=μ_2=μ_3=μ_4=μ_5
Alternative hypothesis
There is a significant difference in satisfaction with IT between work location groups (corporate, CA, DC, and remote)
Ha: μ_1≠μ_2≠μ_3≠μ_4≠μ_5
Solution 4
Null hypothesis:
There is no significant difference in satisfaction with company’s benefit between work location groups (corporate, CA, DC, and remote)
Ho: μ_1=μ_2=μ_3=μ_4=μ_5
Alternative hypothesis
There is a significant difference in satisfaction with the company’s benefit between work location groups (corporate, CA, DC, and remote)
Ha: μ_1≠μ_2≠μ_3≠μ_4≠μ_5
Solution 5
Null hypothesis:
There is no significant difference in satisfaction with a current salary between work location groups (corporate, CA, DC, and remote)
Ho: μ_1=μ_2=μ_3=μ_4=μ_5
Alternative hypothesis
There is a significant difference in satisfaction with a current salary between work location groups (corporate, CA, DC, and remote)
Ha: μ_1≠μ_2≠μ_3≠μ_4≠μ_5
The first step is to interpret the descriptive statistics. What are the means and standard deviations of each group/category? Did the group have identical or similar average scores? Were the scores similarly spread around the means? Briefly, write up your interpretation of the descriptive statistics.
Descriptive statistics
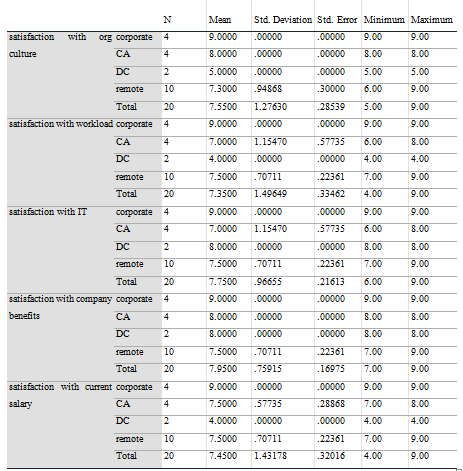
The table above shows that the descriptive statistics of the work location groups and satisfactions. The average satisfaction with org culture for corporate work location is 9, SD=0, M = 8, SD = 0 for CA work location, M = 5, SD = 0 for DC work location, M = 7.3, SD = 0.95 for remote work location. The average satisfaction with work load for corporate work location is 9, SD=0, M = 7, SD = 1.15 for CA work location, M = 4, SD = 0 for DC work location, M = 7.5, SD = 0.71 for remote work location. The average satisfaction with IT for corporate work location is 9, SD=0, M = 7, SD = 1.15 for CA work location, M = 8, SD = 0 for DC work location, M = 7.5, SD = 0.71 for remote work location. The average satisfaction with company’s benefit for corporate work location is 9, SD=0, M = 8, SD = 0 for CA work location, M = 8, SD = 0 for DC work location, M = 7.5, SD = 0.71 for remote work location. The average satisfaction with current salary for corporate work location is 9, SD=0, M = 7.5, SD = 0.58 for CA work location, M = 4, SD = 0 for DC work location, M = 7.5, SD = 0.71 for remote work location.
Next, let’s interpret the one-way ANOVA output. There are lots of numbers, where to begin? I vote for the column labeled Sig! Which of your five ANOVA analyses are statistically significant? And what does this significance indicate? Are we led to reject a null hypothesis? If so, which one(s)? Write up your interpretation of the ANOVA (F test) results, one dependent variable at a time.
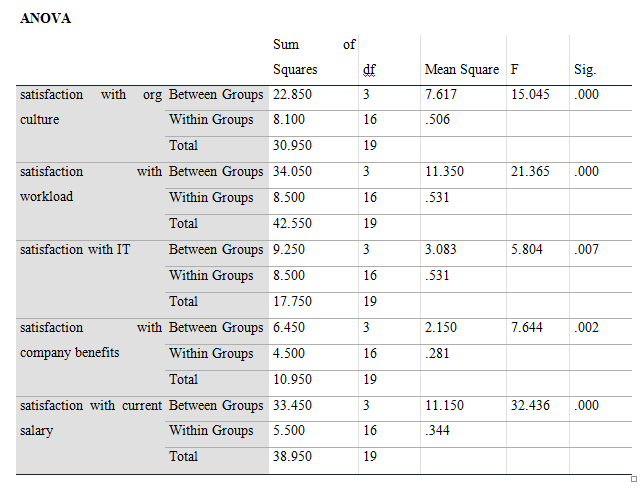
From the result above, we reject the null hypothesis and conclude that there is a significant difference in satisfaction with org culture between work location groups (corporate, CA, DC, and remote), F(3,16) = 15.045, p < 0.05. Also, there is a significant difference in satisfaction with workload between work location groups (corporate, CA, DC, and remote), F(3,16) = 21.365, p < 0.05. Additionally, there is a significant difference in satisfaction with IT between work location groups (corporate, CA, DC, and remote), F(3,16) = 5.804, p < 0.05. Furthermore, there is a significant difference in satisfaction with the company’s benefit between work location groups (corporate, CA, DC, and remote), F(3,16) = 7.644, p < 0.05. Finally, there is a significant difference in satisfaction with a current salary between work location groups (corporate, CA, DC, and remote), F(3,16) = 32.436, p < 0.05.
Next, interpret the posthoc tests. What do the posthoc tests tell you? Again, begin with the Sig column. For each dependent variable, determine between which pairs of means there is statistical significance.
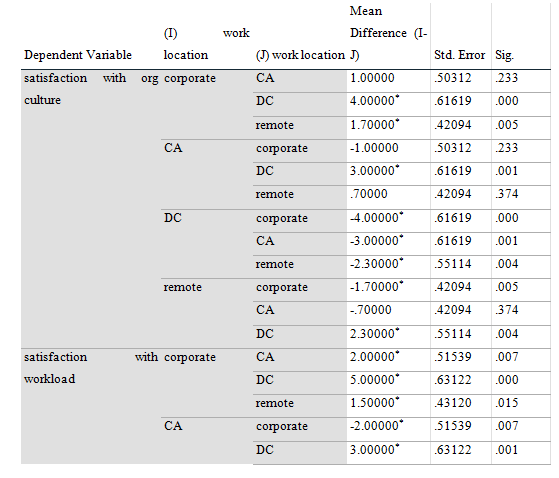
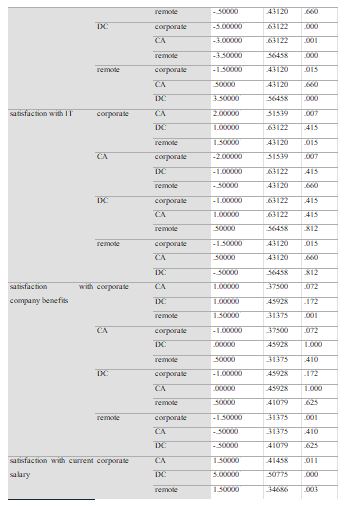
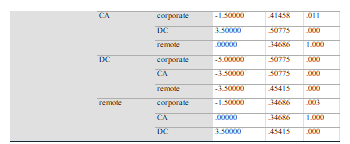
Since the ANOVA test is statistically significant, there is a need to carry out a post hoc test for multiple comparisons. From the satisfaction with org culture, there exists a significant difference between corporate and DC, CA and DC, remote and DC with p < 0.05 at 5% level of significance. For the variable with satisfaction with the workload, there exists a significant difference between corporate and DC, corporate and remote, CA and DC, remote and DC because p < 0.05 is statistically significant at a 5% level of significance. For satisfaction with IT, there exist a significant difference between corporate and remove at a 5% level of significance. For the variable with satisfaction from company’s benefit, there exists a significant difference between corporate and remote because p < 0.05 at 5% level of significance. Lastly, for satisfaction with current salary, there exists a statistical difference between corporate and CA, corporate and DC, corporate and remote, CA and DC, DC and remote with p < 0.05 at 5% level of significance.