Analysis of Variance Assignment
Running ANOVA for Three Treatment Conditions
You are investigating the effects of three different treatment conditions on depressive symptomatology as measured by the Quick Inventory of Depression Scale (QIDS). Using the dataset from assignment #4 (assignment 4 t test data), run an ANOVA with the three treatment conditions (placebo, SSRI, and CBT) as the Factor (or independent variable) and QIDS Post as the dependent variable.
2. State the null hypothesis for this test:
3. What is the value for SSbetween?
4. What is the value for SSwithin
5. What is the value for dfbetween?
6. What is the value for dfwithin?
7. What is the F-ratio value?
8. According to the output, is there a significant difference between groups?
ANOVA Solution
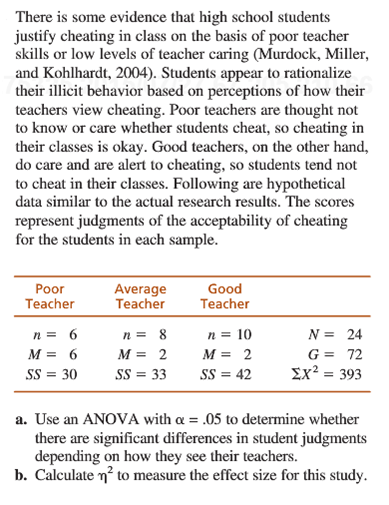
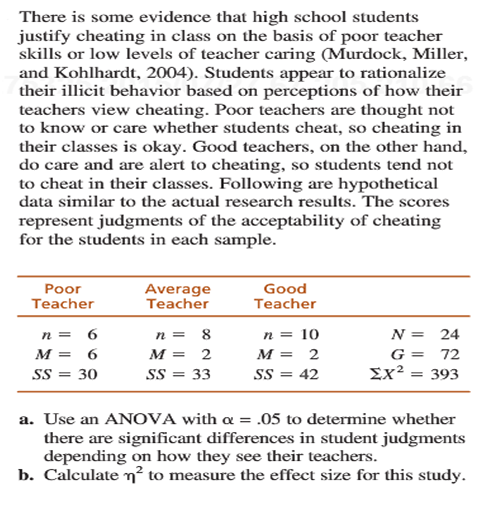
Ans: a. Here is the ANOVA table:
SS
DF
MS
F
Within
105
2
52.5
15.3125
Between
72
21
3.7286
Total
177
23
The p-value of the test is less than 0.0001. Thus there is significant difference in student judgements depending on how they see their teachers.
b. η^2=105/177 = 0.593
You are investigating the effects of three different treatment conditions on depressive symptomatology as measured by the Quick Inventory of Depression Scale (QIDS). Using the dataset from assignment #4 (assignment 4 t test data), run an ANOVA with the three treatment conditions (placebo, SSRI, and CBT) as the Factor (or independent variable) and QIDS Post as the dependent variable.
Result:
ANOVA
Quick Inventory of Depression Scale - SR PostTx
Sum of Squares
df
Mean Square
F
Sig.
Between Groups
1148.933
2
574.467
35.308
.000
Within Groups
927.400
57
16.270
Total
2076.333
59
2. State the null hypothesis for this test:
Ans: There is no difference in QIDS for the three factors.
3. What is the value for SSbetween?
Ans: 1148.933
4. What is the value for SSwithin
Ans: 927.4
5. What is the value for dfbetween?
Ans: 2
6. What is the value for dfwithin?
Ans: 57
7. What is the F-ratio value?
Ans: 35.308
8. According to the output, is there a significant difference between groups?
Ans: Yes, there is a significant difference between the groups as the p-value is 0.000.

